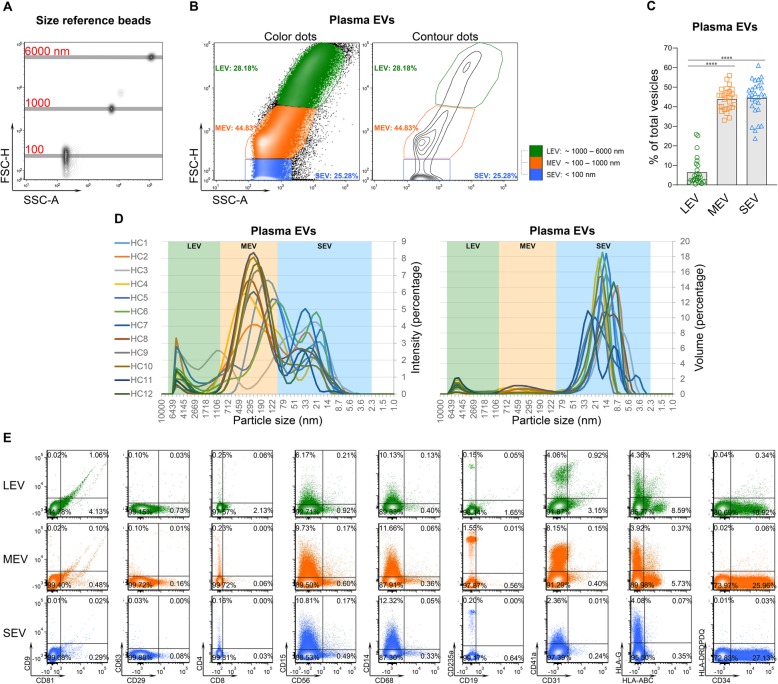
Fig. 1.
High resolution multicolor flow cytometry identified three major subsets of EVs derived from human plasma. a A line was placed on the center of each bead population to generate a size reference scale with the tested beads (100, 1000 and 6000 nm) overlaid in one plot. (FSC-H: Forward Scatter-Height; SSC: Side Scatter-Area.) b A representative color dot plot from plasma EVs of one HC. Based on the size reference scale, plasma EVs from HCs showed 3 concentrated subsets from large to small: LEV, MEV and SEV. c The graphs present a summary of plasma EVs from HCs (n = 28). Comparisons between EV subsets were performed using a Friedman test with Dunn’s multiple comparisons test, ****p < 0.0001. d Separated plasma EVs (n = 12) were characterized by dynamic light scattering (DLS). The graphs present the intensity and volume of the 3 major subsets of plasma EVs. e Separated plasma EVs were re-suspended in df-PBS, and stained with fluorescence-conjugated antibodies against the indicated surface markers. The percentages of EVs expressing each tested molecule in the gated LEV, MEV and SEV populations were determined by high resolution multicolor flow cytometry. Representative color dot plots present results of all tested surface markers in gated individual plasma EV subsets from one HC

