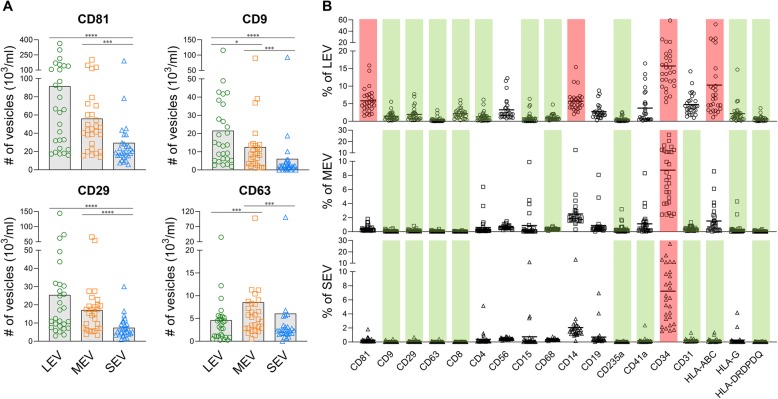
Fig. 2.
Relative abundance of EVs in healthy human plasma showing CD34+ EVs were abundant. Separated EVs were stained with fluorescence-conjugated antibodies against the indicated surface markers. The percentages and absolute number of EVs expressing each tested molecule were determined by high resolution multicolor flow cytometry. a The graphs present a summary of the absolute number of EVs expressing the indicated surface marker in each EV subset in plasma of HCs (n = 28). Comparisons were performed using a Friedman test with Dunn’s multiple comparisons test, *p < 0.05, **p < 0.01, ***p < 0.001, ****p < 0.0001. b The graphs present a summary of individual biomarker expression in plasma EV subsets from HCs (n = 28). Comparisons between the tested surface markers in each gated EV subset were performed using a Friedman test with Dunn’s multiple comparisons test; p values are presented in the Additional file 3: Table S1B. Red bars indicate the relatively highly expressed surface markers (percentage > 5% of the gated EV populations and significantly higher than at least three other tested markers). Green bars indicate surface markers with low expression (percentage significantly lower than at least three other tested markers)

