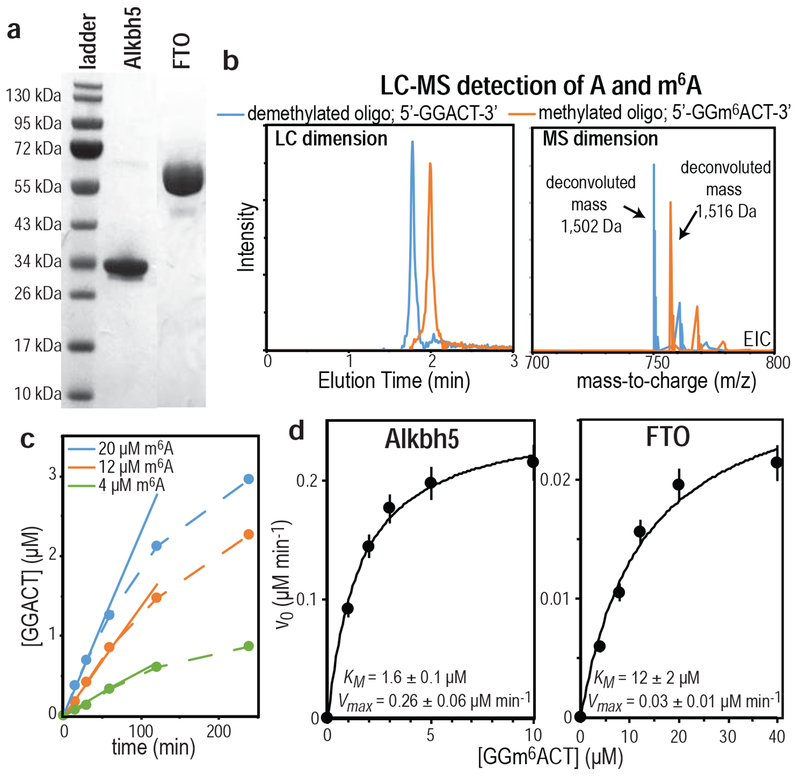
Figure 3.
(a) SDS-PAGE analysis of purified Alkbh5 (lane 2) and FTO (lane 3). The molecular weight marker is shown in lane 1. (b) Example of extracted LC-MS data measured for the m6A demethylation reaction catalyzed by FTO. The LC dimension (left panel) shows two well resolved signals (colored blue and orange, respectively). The MS dimension of the experiment (right panel) reveals that the blue and orange peaks correspond to the −2 ionized species of the demethylated and methylated nucleotide, respectively. The smaller peaks observed in the MS dimension correspond to Na+ adducts. (c) Plot of the concentration of demethylated nucleotide versus time measured for the demethylation reaction catalyzed by FTO at three different concentrations of substrate (4 μM, green; 12 μM, orange; 20 μM, blue). The slope of the linear portion of the plot (solid line) has been fit to determine the initial velocity of the reaction (v0). (d) Michaelis-Menten plot for the demethylation reaction catalyzed by 0.1 μM Alkbh5 (left panel) and 2.0 μM FTO (right panel).

