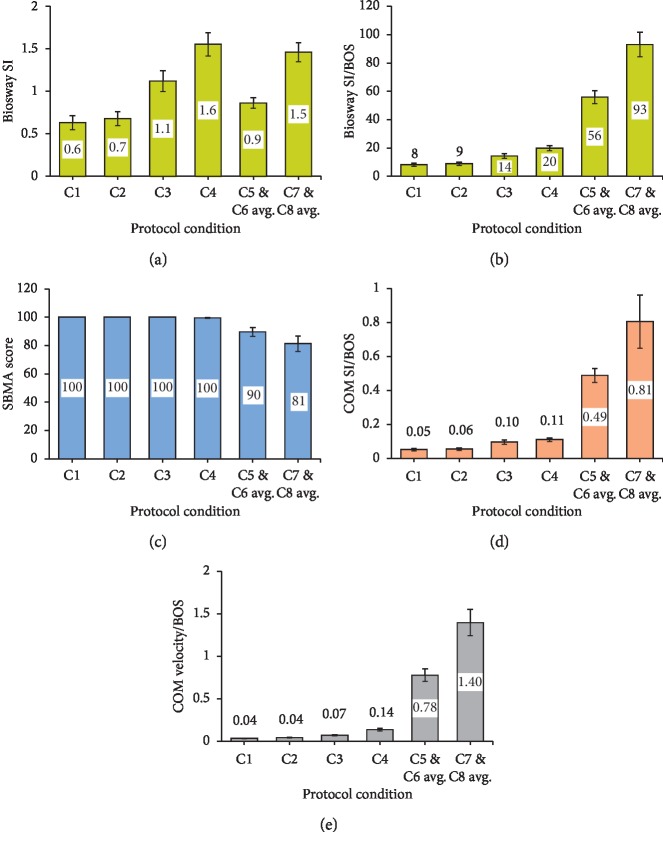
Figure 3.
Bar graphs of means with 95% confidence interval (error bars) for dependent variables (a) Biosway Sway Index (SI), (b) Biosway SI/Base of Support (BOS), (c) SWAY Balance Mobile Application (SBMA) score, and Center of Mass (COM) Balance indices ((d) COM SI/BOS and (e) COM velocity/BOS) across increasing level of difficulty (C1–C8) with C5 and C6 averaged and C7 and C8 averaged for analysis of variance (ANOVA). A larger velocity and SI score represent more postural sway. A larger SBMA score represents less postural sway.

