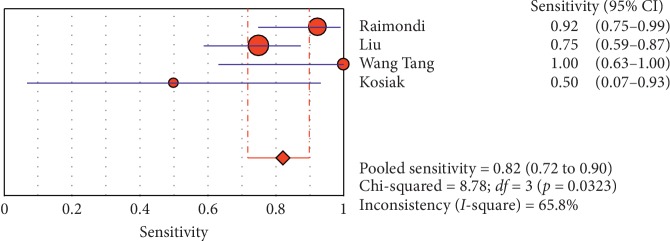
Figure 17.
Sensitivity of the “lung point” sign in ultrasound in diagnosis of pneumothorax. The Forest plot of sensitivity reported in each study. Each study is identified by the name of the first author and year of publication, with circles representing individual study point estimates, size of each circle indicating relative contribution to data pooling (inverse variance weighting), horizontal lines indicating 95% CIs, and dashed vertical lines representing 95% CIs for pooled sensitivity and specificity.

