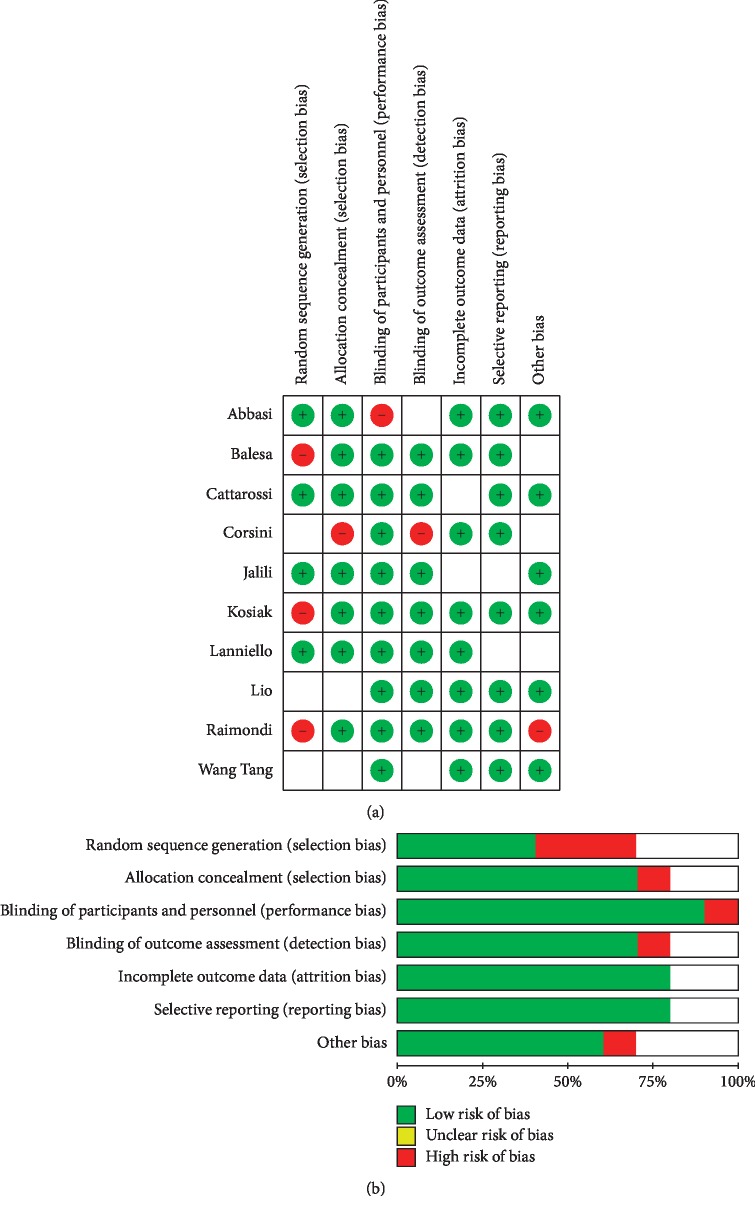
Figure 2.
The risk of bias in the studies conducted was measured by using the QUADAS-2 tool. The risk of bias shown in equation b of the above image model (ultrasound) of each diagram indicates the number and percentage of studies with high (red), medium (yellow), and low (green) risk of bias in four groups of the QUADAS-2 tool.

