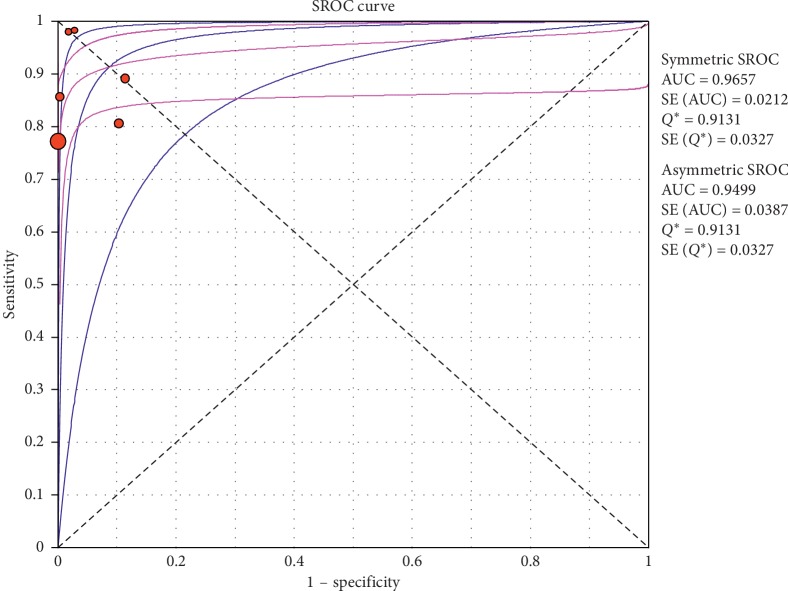
Figure 5.
Summary-ROC (SROC) curve for diagnostic accuracy of ultrasound in diagnosis of pneumothorax in adults and neonates. Size of each circle on graph represents the sample size of included study. SE = standard error; Q∗ index = point at which sensitivity and specificity are equal or point closest to the ideal top-left corner of SROC space.

