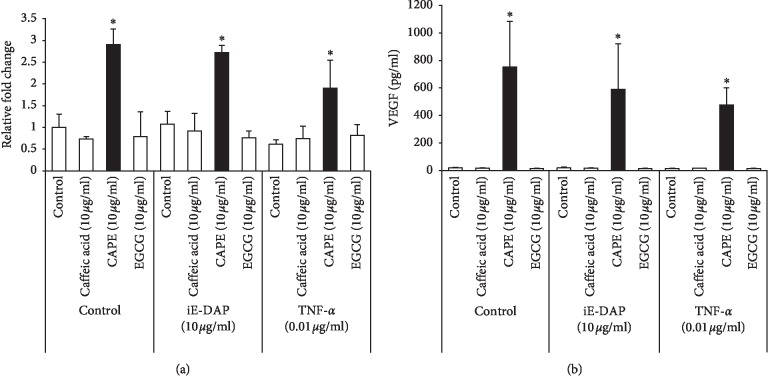
Figure 4.
Expressions and productions of VEGF in CAPE-treated KN-3 cells in normal medium. KN-3 cells were stimulated with iE-DAP (10 μg/ml) or TNF-α (0.01 μg/ml) under the treatment with caffeic acid (10 μg/ml), CAPE (10 μg/ml), or EGCG (10 μg/ml) for 6 and 24 hours in normal medium. (a) After 6-hour stimulation, total RNA was isolated and mRNA expression levels of VEGF were analyzed by real-time RT-PCR. Values represent the means ± SDs of three independent experiments, and each experiment was performed in triplicate. Asterisks indicate significant differences versus nontreated control (without polyphenols) (∗p < 0.05 vs. control). (b) The concentrations of VEGF in the cell culture supernatants after 24-hour stimulation were determined by ELISA. Values represent the means ± SDs of three independent experiments, and each experiment was performed in triplicate. Asterisks indicate significant differences versus nontreated control (without polyphenols) (∗p < 0.05 vs. control).

