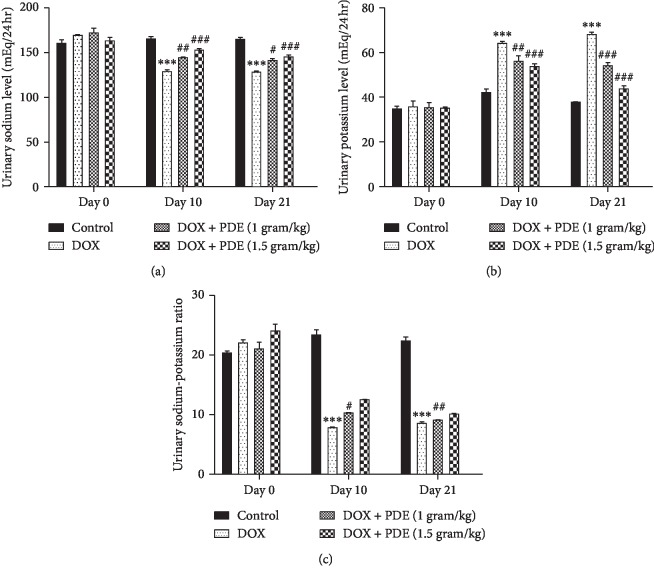
Figure 4.
Effects of PDE on urinary (a) sodium, (b) potassium, and (c) sodium-potassium ratio levels in DOX-induced changes in rats. The values are mean ± SEM (n = 6). Statistical analysis was done through two-way analysis of variance (ANOVA) followed by Bonferroni post hoc test. For determination of p values, DOX is compared with the control group, and treatment groups were compared with the DOX group. The results are considered significant if p < 0.05. ∗∗∗p < 0.001 vs. control; #p < 0.05; ##p < 0.01 and ###p < 0.001 vs. DOX.

