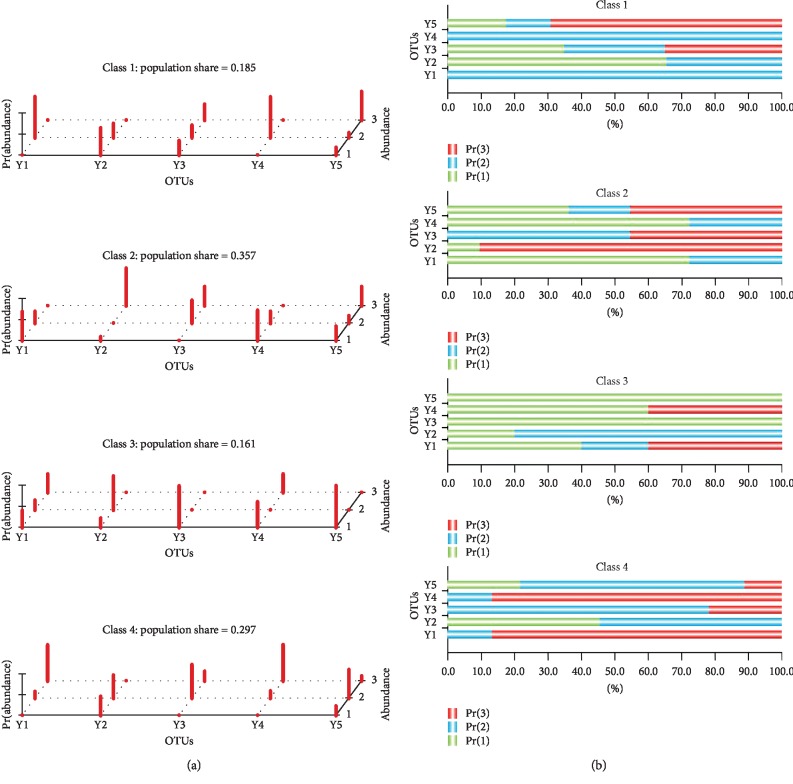
Figure 6.
Latent variable analysis based on five bacteria. (a) 3D plot of the latent model. In the OTU axis, Y1, Y2, Y3, Y4, and Y5 indicate five bacteria: s_Prevotella_copri, s_Bacteroides_stercoris, f_Prevotellaceae, g_Bacteroides (OTU_736), and g_Bacteroides (OTU_1112). In the abundance axis, 1, 2, and 3 indicate three levels of absolute abundance (<33rd percentile, >33rd percentile and <66rd percentile, and >66rd percentile), respectively. In the Pr(abundance) axis, the red bar indicates the posterior probability of five bacteria responses across the classes. (b) 2D plot of the latent model showing the same information as that of the 3D plot.

