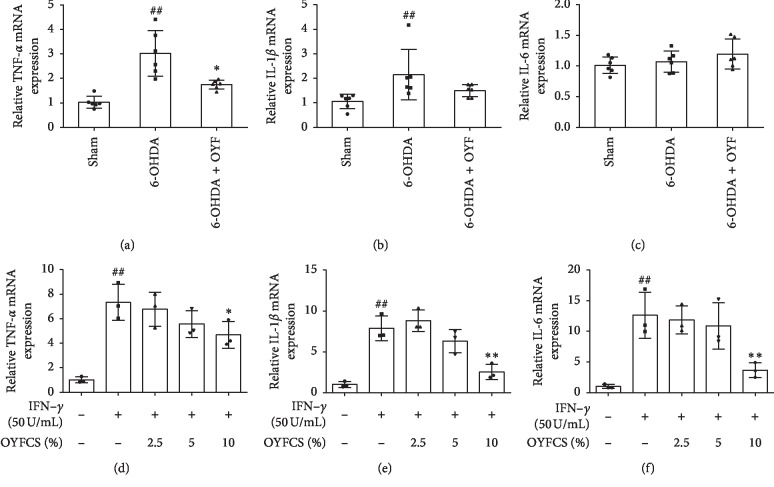
Figure 5.
Effects of OYF on TNF-α, IL-1β, and IL-6 mRNA levels in in vivo and in vitro. Relative mRNA expression of TNF-α (a), IL-1β (b), and IL-6 (c) in the ipsilateral SN of rats. Relative mRNA expression of TNF-α (d), IL-1β (e), and IL-6 (f) in IFN-γ-induced RAW264.7 cells. Values are expressed as mean ± SD. n = 5-6 per group in the in vivo experiment, n = 3 per group in the in vitro experiment. ##P < 0.01 vs. the sham group or the control group, and ∗P < 0.05 and ∗∗P < 0.01 vs. the 6-OHDA group or the IFN-γ group.

