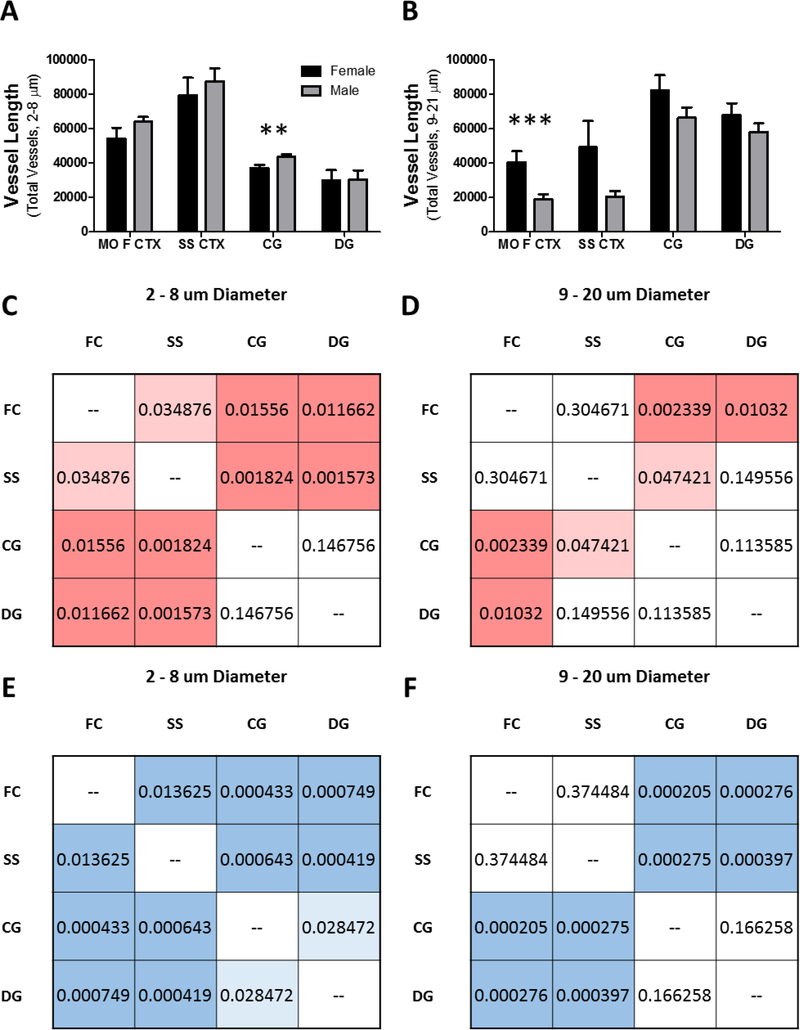
Figure 8: Inter-subregional differences in the vascular architecture vary in magnitude between the sexes.
Grouped bar graph (mean ± SEM) depicting (A) total length of capillaries (2 – 8 μm) and (B) total length of non-capillaries (9 – 21 μm) in micrometers for each of the brain subregions. Inter-subregiona l analyses of the differences in total (C and E) capillary and (D and F) non-capillary length in (C and D) female and (E and F) male mice represented as mean p – values color by hue intensity to the level of significance. Brain subregions (500 x 500 x 500 um): medial orbital prefrontal cortex (MO F CTX), primary somatosensory cortex (SS CTX), cingulate gyrus (CG), dentate gyrus (DG). To compare means, 2 - way ANOVA with Bonferroni multiple comparison analysis was used (**, p < 0.01; ***, p < 0.001).

