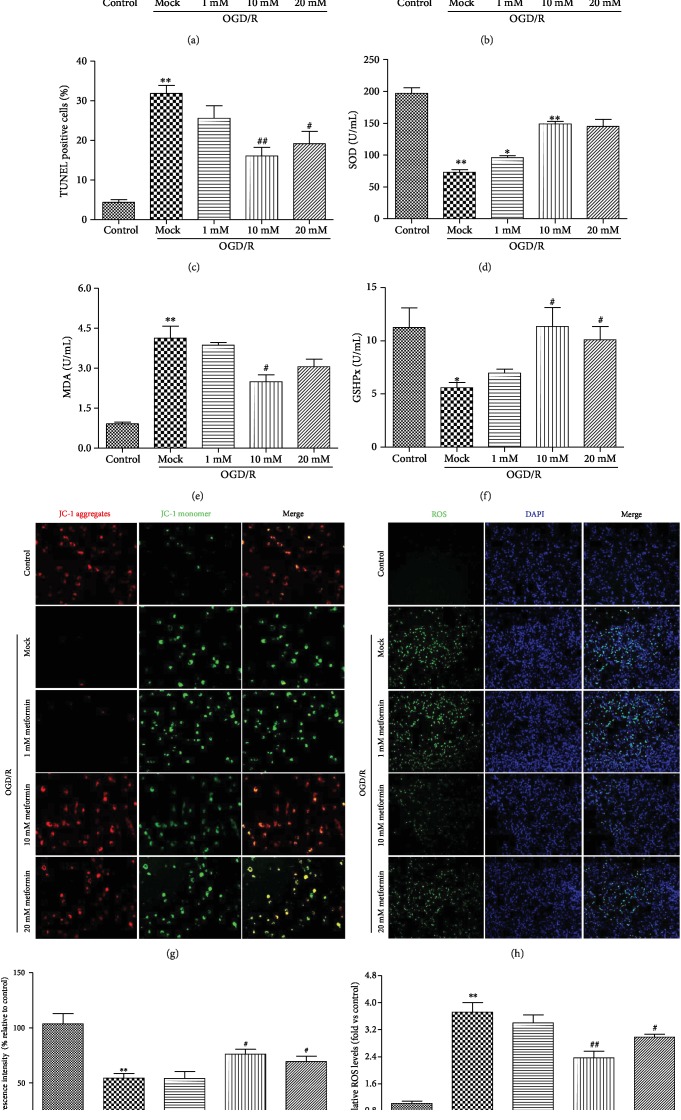
Figure 3.
Metformin protected N2a cells against oxidative stress injury under conditions of OGD/R-induced hypoxia. (a) The viability of N2a was determined by CCk8 assay. (b) The levels of LDH were assessed by the LDH kit assay. (c) The apoptosis of N2a was evaluated using TUNEL staining. (d) Activities of SOD in the supernatant of cell culture medium. (e) Levels of MDA in the supernatant of cell culture medium. (f) Activities of GSHPx in the supernatant of cell culture medium. After 24 reperfusion hours, mitochondrial membrane potential (g) and ROS (h) were determined by JC-1 dying or DCFH-DA, respectively. The nucleus was stained with Hoechst 33342 in blue. (i) ROS fluorescence intensity was measured and presented in a bar graph. (j) MMP fluorescence intensity was calculated as the red/green fluorescence ratio. Data are represented as means ± SD (n = 3 per group). ∗p < 0.05 and ∗∗p < 0.01 versus the control group by 1-way analysis of variance with Tukey's multiple comparison test. #p < 0.05 and ##p < 0.01 versus the mock group by 1-way analysis of variance with Tukey's multiple comparison test. Abbreviations: MMP: mitochondrial membrane potential; ROS: reactive oxygen species; SD: standard deviation. The colored version of the figure is available online.

