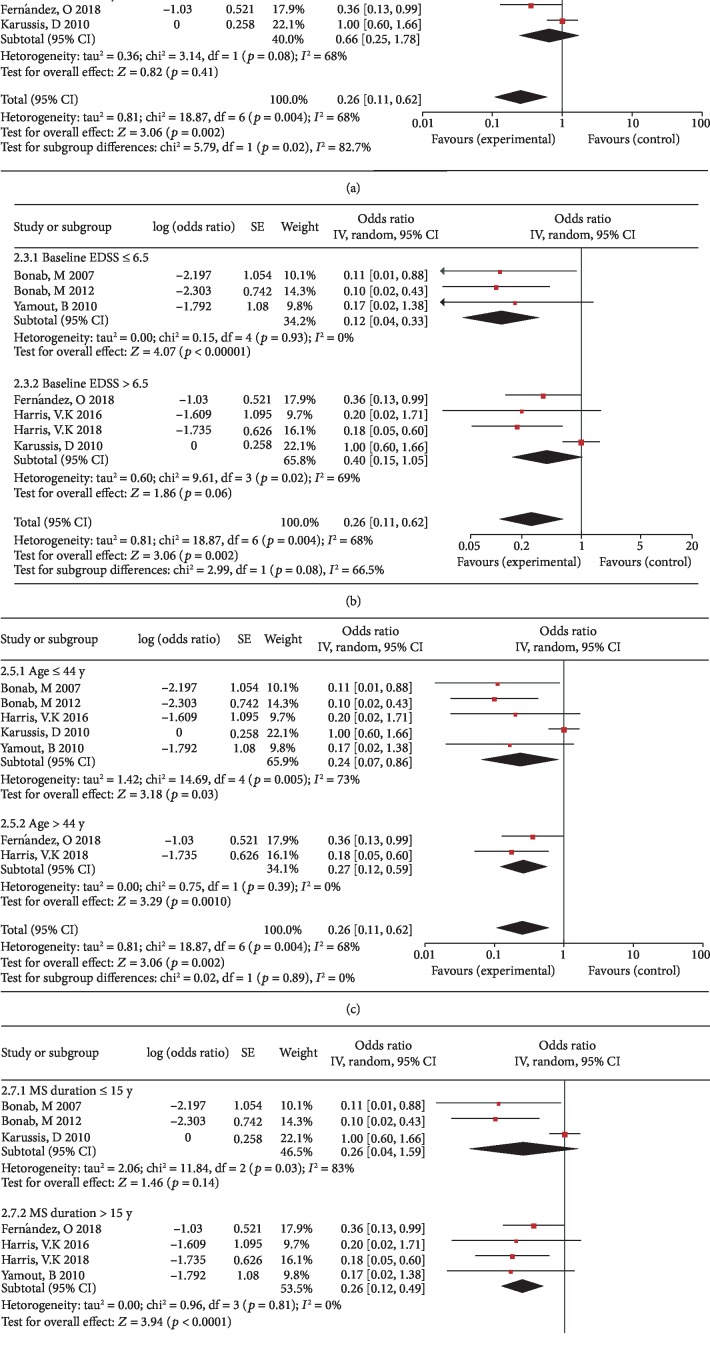
Figure 5.
Forest plot of subgroup meta-analysis of the rates of disease progression at 6 months. (a) Subgroup analyses of intrathecal injection versus intravenous injection. (b) Subgroup analyses of baseline EDSS ≤ 6.5 versus baseline EDSS > 6.5. (c) Subgroup analyses of baseline age ≤ 44 y versus baseline age > 44 y. (d) Subgroup analyses of MS duration ≤ 15 y versus MS duration > 15 y. Squares indicate the risk ratio, and horizontal lines represent 95% confidence intervals.

