
Figure 1. In the left panel the plasma apoA-I pattern obtained after two-dimensional gel electrophoresis is shown. To the right a schematic diagram of all the A-I containing HDL particles is shown.
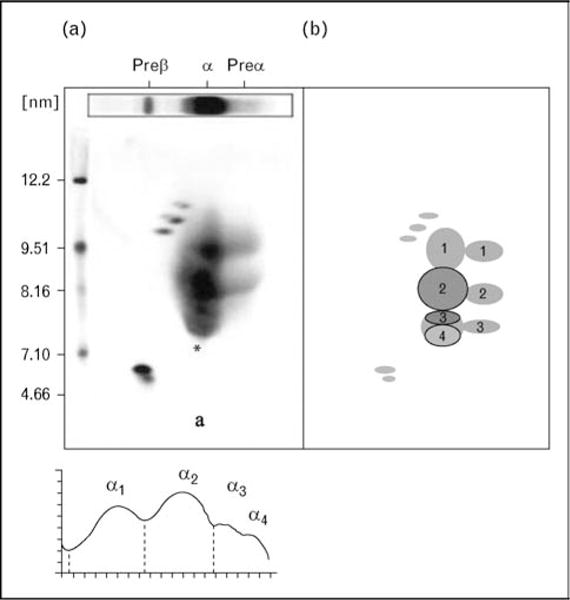
Particles are separated by size (diameter in nm) in the vertical dimension and by charge in the horizontal dimension into particles of preβ, α, and preα mobility.