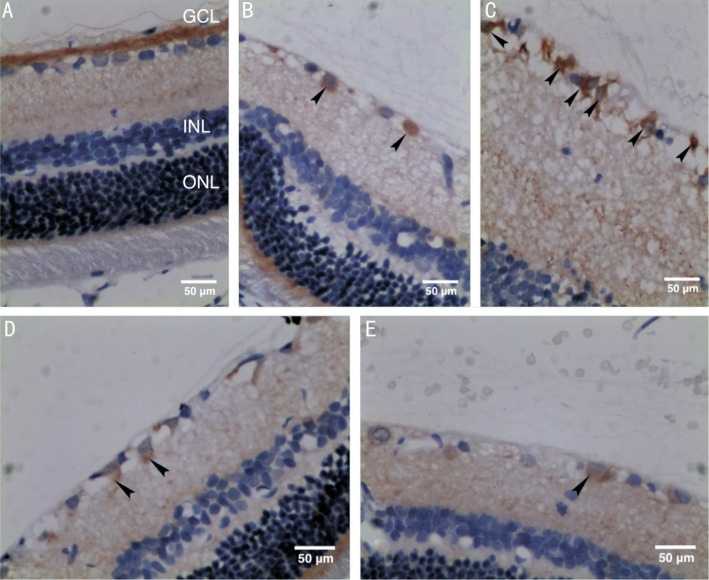
Figure 3. Distribution of LC3 in rats' retina (immunohistochemical staining, 400×) with arrowheads pointing to brown RGCs.
A: An image of the retina from the control group; B: An image of the retina at 6h after reperfusion (group A); C: An image of the retina at 12h after reperfusion (group B); D: An image of the retina at 24h after reperfusion (group C); E: An image of the retina at 48h after reperfusion (group D).

