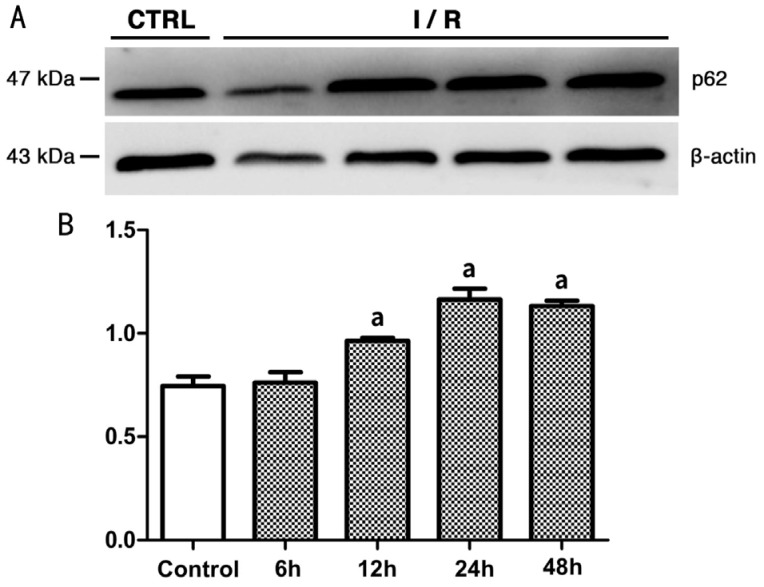
Figure 8. Expression level of p62 in rats' retina of each group.
A: Western blot radioactive detected bands of p62 and β-actin; B: The amount of p62 in each group after normalized to β-actin (n=5). aSignificant difference (P<0.05) between the experimental groups and the control group (one-way ANOVA, LSD test).

