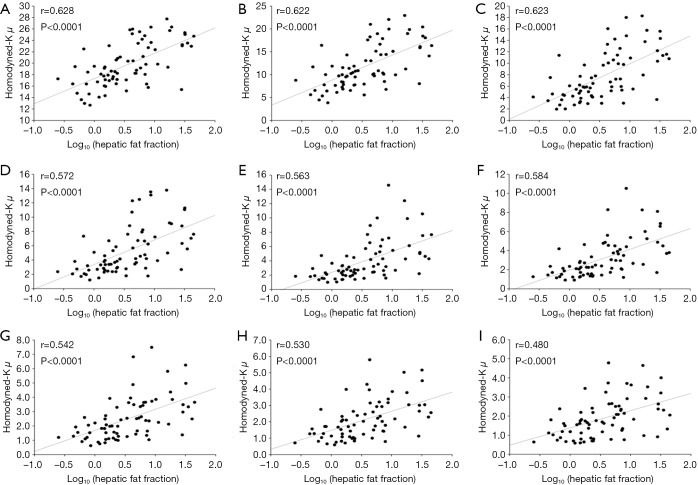
Figure 6.
Scatter plots and linear fitting curves of μXU as a function of log10(HFF) for the 72 participants in group A. (A-I) Correspond to the average value of μXU within the ROI of μXU parametric images constructed using WSL =1, 2, 3, 4, 5, 6, 7, 8 and 9 PLs, respectively. The correlation coefficient, r, of log10(HFF) is 0.628, 0.622, 0.623, 0.572, 0.563, 0.584, 0.542, 0.530 and 0.480 for WSL =1, 2, 3, 4, 5, 6, 7, 8 and 9 PLs, respectively. All the corresponding P values are <0.0001. HFF, hepatic fat fraction; ROI, region of interest; WSL, window side length; PL, pulse length.

