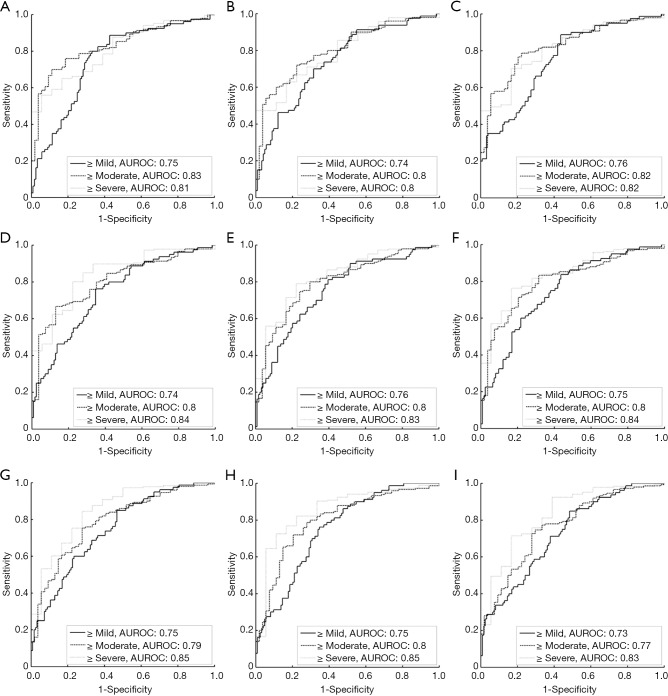
Figure 8.
ROC curves for diagnosing different hepatic steatosis stages for the 204 patients in group B, using μXU. (A-I) Correspond to the average value of μXU within the ROI of μXU parametric images constructed using WSL =1, 2, 3, 4, 5, 6, 7, 8 and 9 PLs, respectively. The AUROCs obtained, using μXU (95% CIs) for fatty stages ≥ mild, ≥ moderate, and ≥ severe were (AUROC1, AUROC2, AUROC3) = (0.75, 0.83, 0.81), (0.74, 0.80, 0.80), (0.76, 0.82, 0.82), (0.74, 0.80, 0.84), (0.76, 0.80, 0.83), (0.75, 0.80, 0.84), (0.75, 0.79, 0.85), (0.75, 0.80, 0.85) and (0.73, 0.77, 0.83) for WSL =1, 2, 3, 4, 5, 6, 7, 8 and 9 PLs, respectively. AUROC, area under the ROC; ROC, receiver operating characteristic; ROI, region of interest; WSL, window side length.

