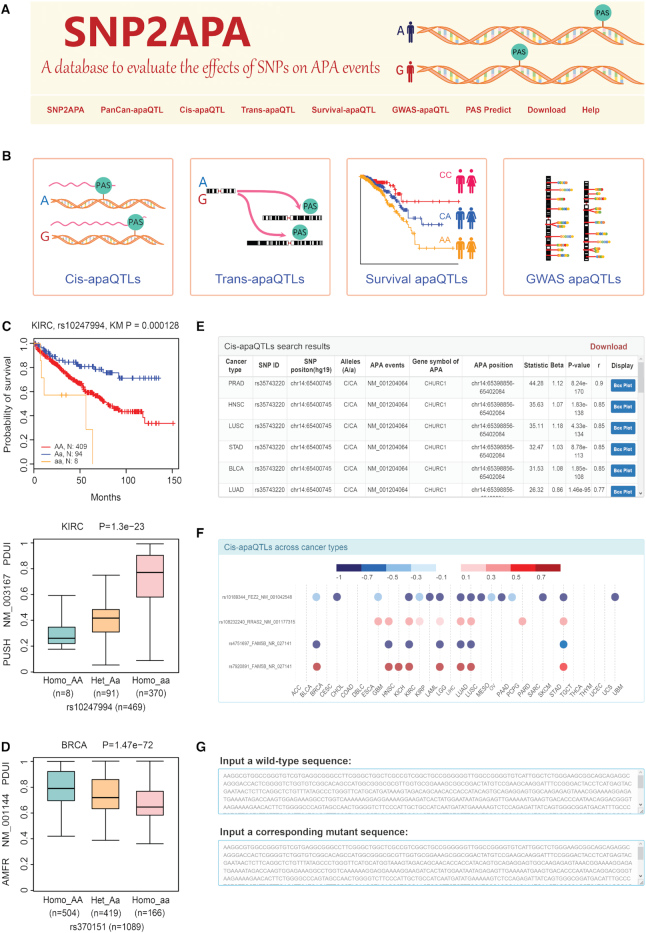
Figure 2.
The interface of SNP2APA database. (A) Browser bar in SNP2APA. (B) Modules of cis- and trans-apaQTL, survival apaQTL and GWAS apaQTL. (C) An example of survival apaQTL. KM-plot indicated that rs10247994 in KIRC was highly association with patient survival time, and box plot indicated that rs10247994 in KIRC was highly associated with PDUI values of the APA event in PUSH gene. (D) An example of GWAS apaQTL. Box plot indicated that GWAS associated apaQTL rs370151 in BRCA was highly associated with PDUI values of the APA event in AMFR. (E) Search results of cis-apaQTL dataset. (F) The heatmap displaying the correlation coefficient (r) of apaQTLs in the ‘Pancan-apaQTL’ page. The label for y-axis contains SNP ID, gene symbol of APA and APA event. (G) The input of online PAS prediction tool.

