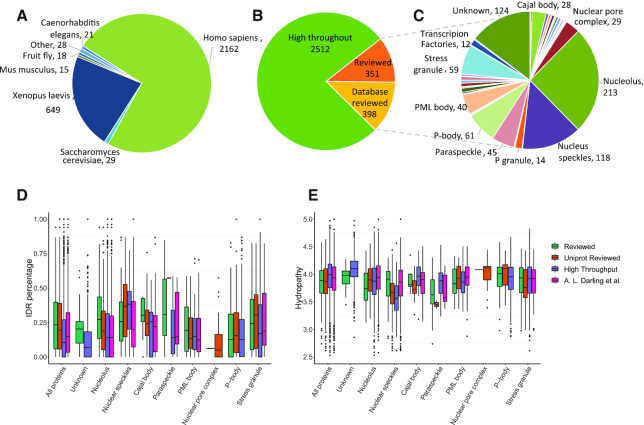
Figure 2.
PhaSepDB content. (A–C) Data statistics of PhaSepDB. (A) Organism distribution; (B) data source distribution and (C) membraneless organelles localization distribution in reviewed data. (D and E) Molecular properties of proteins in eight membraneless organelle. ‘Unknown’ refers to proteins that were not associated with any known organelles. ‘All proteins’ refers to all proteins analyzed in the plot. (D) IDR percentage was extracted from MobiDB database (40) and hydropathy (E) were calculated using CIDER (36).

