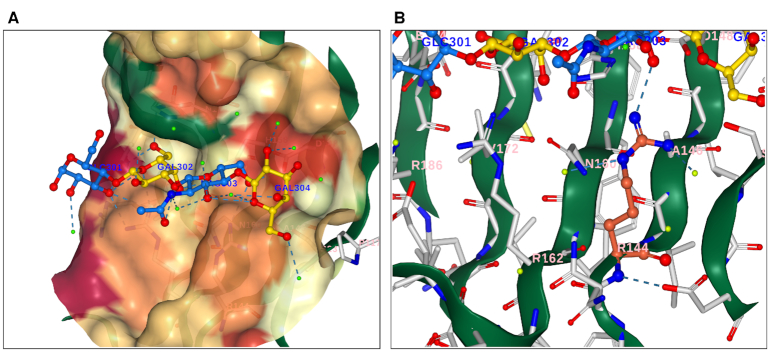
Figure 2.
Ligand View (NGL based) for the ligand information page displaying the complete ligand for the PDB ID:4BLN. (A) Ligand is displayed as ball-and-stick representation with each distinct PDB residue depicted following SNFG nomenclature: β-D-galactose yellow, α-D-glucose and N-acetyl-D-glucosamine in blue. Water molecules are displayed in light green. Amino acids 4 Å or closer to the ligand are displayed as ball-and-stick representation and coloured in light grey. Contacts are represented in dashed lines. Surface opacity is set to 60%, and coloured based on hydrophobicity (green, for hydrophobic residue, to red, for hydrophilic residues). (B) In-depth analysis of the binding pocket. ARG144 was selected and it is displayed in dark orange. In light grey are depicted protein residues. At the top, the same ligand observed in (A) is present, with the same colouring scheme. Only interactions between ARG144 and any other molecule are displayed. Surface opacity is 0%.

