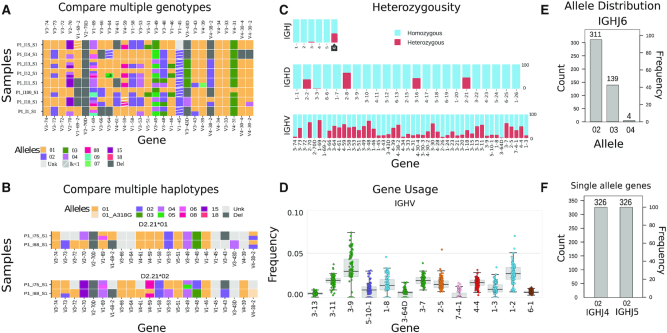
Figure 2.
Data visualizations in VDJbase. (A) Comparison between 8 genotypes. Row and column represent individual and gene, respectively. Colors correspond to alleles. (B) Comparison between two haplotypes. Haplotype is inferred using the IGHD2-21 gene as an anchor gene. The upper panel corresponds to the chromosome carrying IGHD2-21*01 and the lower panel to the chromosome carrying IGHD2-21*02. (C) Heterozygosity abundance for each gene in the samples of interest. (D) Gene usage. Each point represents an individual. Colors correspond to V family gene. (E) Allele appearance of IGHJ6. Left Y axis corresponds to the number of individuals, and the right Y axis corresponds to the frequency of the allele in the samples of interest. (F) Allele appearance of IGHJ4 and IGHJ5. Y axis is the same as in (E). Gene order in all graphs correspond to their location on the chromosome.

