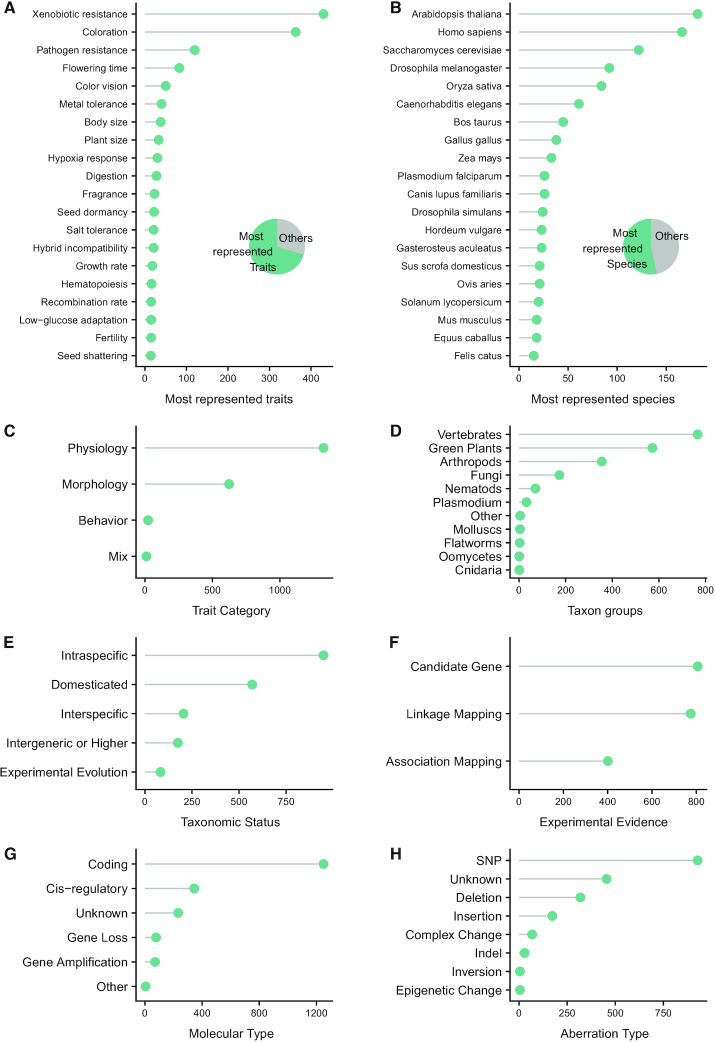
Figure 4.
Summary statistics for current Gephebase data. Y-axes indicate the number of entries for each category. (A) Distribution of the twenty most represented Traits. (B) Distribution of the twenty most represented Taxon B species. Pie charts in (A, B) show the distribution of all entries between the twenty most represented Traits (A)/Species (B) and the remaining others. (C) Distribution of Trait Categories (Morphology, Physiology, Behavior, Combination of at least two trait categories). (D) Distribution of Taxon Groups. (E) Distribution of Taxonomic Status. (F) Distribution of Empirical Evidences. (G) Distribution of Molecular Types of genetic changes. ‘Other’ corresponds to mutations creating chimeric genes or to super gene loci. (H) Distribution of Aberration Types. ‘Indel’ corresponds to cases where the direction of change is unknown. When several mutations are reported within one entry, only the first curated mutation of the entry was used for statistical analysis (see Data S1 for the R script).

