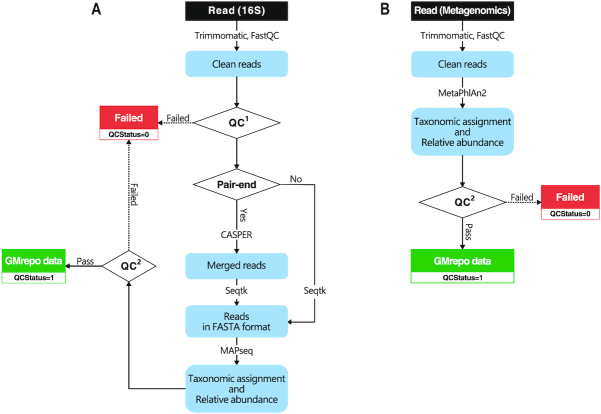
Figure 2.
Schematic representations of the GMrepo metagenomics pipeline for amplicon data (A) and metagenomic data (B). Processing steps are indicated in the blue rounded boxes and tools are marked on the arrows. Input and output files as colored rectangles (black, green, red). Conditional judgments are in trapezoids. QC1: a run will be marked as ‘failed’ (QCStatus = = 0) if less than 20k reads or <50% of reads were retained after trimming; QC2: arun will be marked as ‘failed’ (QCStatus = = 0) if a single taxon accounts for >99.99% of the total abundance.

