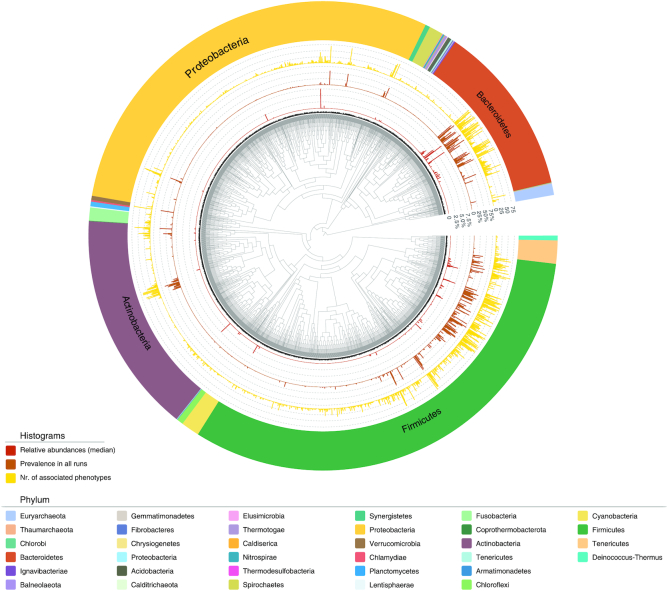
Figure 4.
Phylogenetic tree comprising the 2685 included species, based on NCBI taxonomy. These 2685 species were found in more than one samples with a median relative abundance higher than 0.01% within one or more phenotypes. The three inner layers show the statistics of these species in our database, including the median relative abundance of the species (red) and the species prevalence in the samples (brown) and phenotypes (yellow). The outermost layer shows the corresponding phyla of these species.

