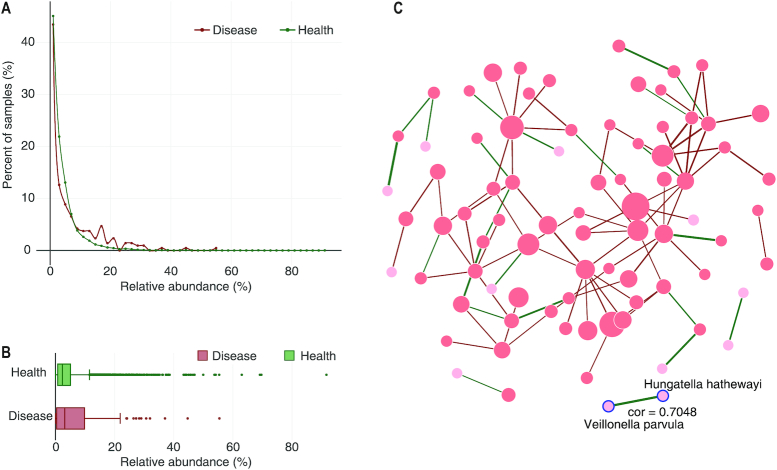
Figure 5.
Details of a species in Crohn's Diseases. Faecalibacterium prausnitzii is chosen to show its distributions (A) and relative abundances (B) in Crohn's Disease. For various disease phenotypes, the relative abundances of the species of interest in healthy controls (green) will also be retrieved and visualized side-by-side with the disease (red). (C) A species co-occurrence network constructed based on the significantly co-occurred pairs for a phenotype (Crohn's Disease). Nodes: species co-occurred with others in samples of this phenotype with sizes proportional to the number of connected nodes in the network. Links: indicate co-occurring relationships between species with widths proportional to the absolute value of the correlation coefficient (Pearson correlation), while the colors indicate positive (green) or negative (red) correlations. Placing a mouse over a node can highlight the node and its direct neighbors and show the names of the node and its direct neighbors.

