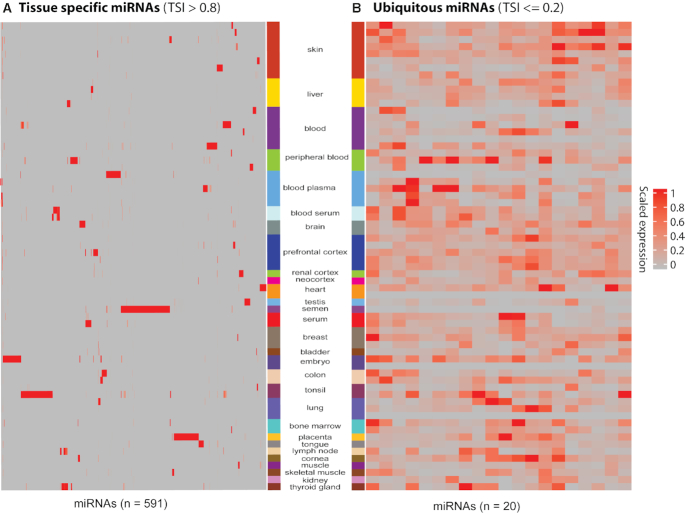
Figure 2.
Tissue specific miRNAs. The heatmaps show the scaled expression (0-1) of (A) tissue specific or (B) ubiquitous miRNAs across all the tissues. (A) Tissue specific miRNAs. miRNA expression across all the tissues with TSI > 0.8 (n = 591). (B) Ubiquitous miRNAs. miRNA expression across all the tissues with TSI ≤ 0.2 (n = 20). miRNA names are omitted for simplicity. A complete list of tissue specific and ubiquitous miRNAs with their Shannon entropy score can be found in Supplementary Table S1. These calculations are based on healthy and disease samples within an experiment (‘Materials and Methods’ section).

