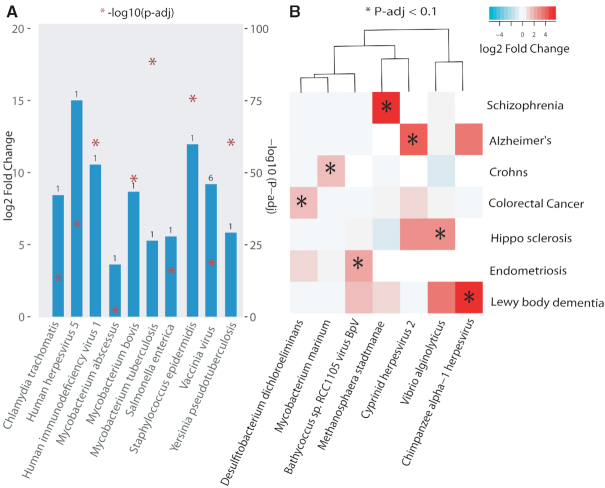
Figure 3.
Known and Novel bacterial or viral infections. (A) Known associations. Pathogen detection using seven datasets known to be infected with seven bacterial and three viral pathogens. Bar represents pathogen log2-fold difference between the uninfected and infected state (Supplementary Table S2). Number on top of the bar denotes rank of the pathogen compared to all the other DE pathogens within the comparison (i.e. smallest adjusted P-value). (B) Novel associations. Heatmap shows log2-fold difference of pathogens significantly upregulated in disease as compared to healthy (fold change > 1 and padj < 0.1) (Supplementary Table S2). Comparisons that have less than six pathogens significantly DE are selected for specificity. Details about dataset, comparison groups, log2fold and padj for both (A and B) are provided in (Supplementary Table S2).

