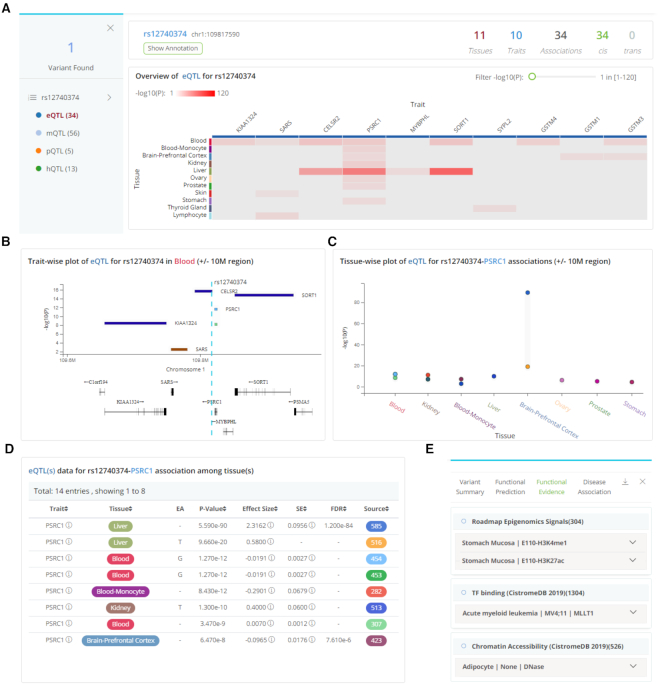
Figure 2.
QTLbase variant-level query results. (A) Major result panels show matched QTL types, basic QTL statistics, and a heat map plot of associated QTLs across traits and tissues for the queried variant. (B) Trait-wise plot of associated QTLs in specific tissue/cell type for queried variant. (C) Tissue-wise plot of associated QTLs on specific trait for queried variant. (D) Summary statistics table of associated QTLs. (E) Floating panel for functional annotations.

