
Figure 5.
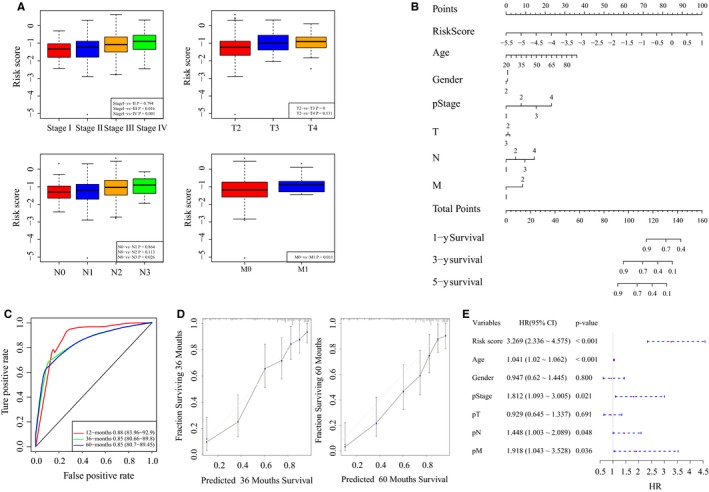
The association between the 6‐lncRNA signature and clinical characteristics. A, The distribution of risk scores according to different clinical information. B, The nomogram to predict the probabilities 1‐y, 3‐y, and 5‐y OS in patients. C, ROC curves according to the nomogram and lncRNA risk score. D, Calibration plots to predict the 3‐y and 5‐y OS of patients. The probability of survival predicted by the nomogram was plotted on the x‐axis, and actual survival was plotted on the y‐axis. E, The forest plot of risk scores and clinical characteristics