
Figure 6.
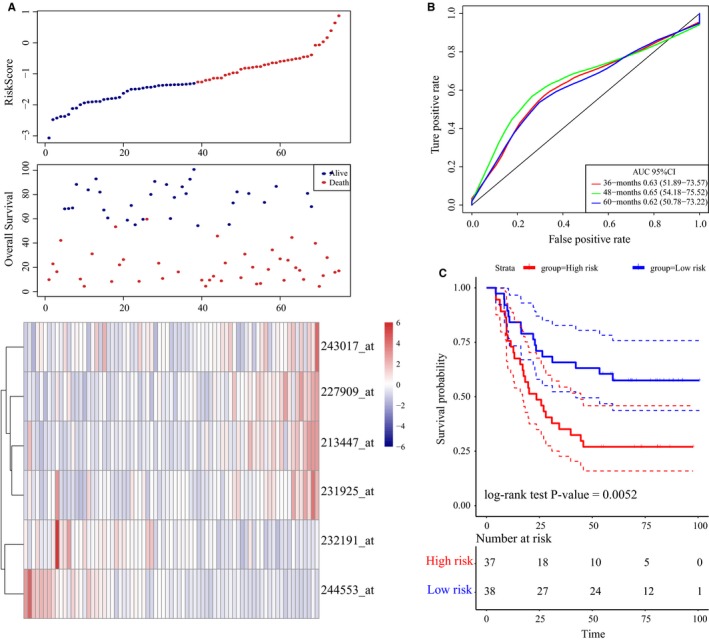
LncRNA risk score analysis using the internal validation set http://www.ncbi.nlm.nih.gov/geo/query/acc.cgi?acc=GSE62254. A, Distribution of 6‐lncRNA‐based risk scores, lncRNA expression levels and patient survival durations in the internal validation set http://www.ncbi.nlm.nih.gov/geo/query/acc.cgi?acc=GSE62254 (n = 75). B, ROC curve analyses based on the 6‐lncRNA signature. C, Kaplan‐Meier curves of OS based on the 6‐lncRNA signature