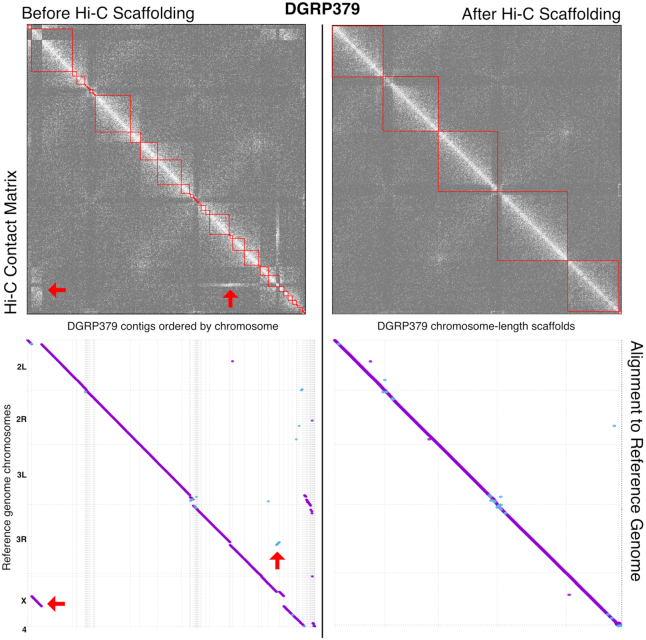
Figure 1.
DGRP379 nanopore genome assembly before and after Hi-C scaffolding. The top half of the figure shows the Hi-C contact matrices before and after scaffolding. Lighter shades indicate more 3D interactions between genomic regions and darker shades indicate fewer interactions. The red boxes show the location of contigs/scaffolds and red arrows point to off-diagonal interactions that are due to assembly errors in the contigs. The bottom half of the figure shows dotplots representing the alignment of the assembly to the D. melanogaster iso-1 reference genome before and after scaffolding. The red arrows point to the contig assembly errors.

