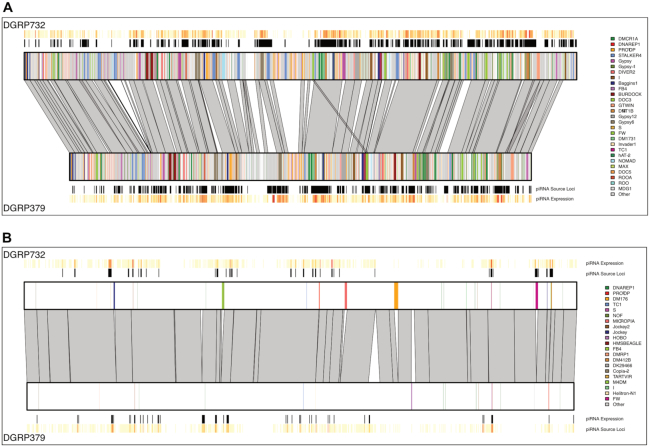
Figure 5.
Pericentric heterochromatin contains abundant structural variation. The two panels show the location of nucmer alignments (grey polygons) between the two DGRP strain genome assemblies for a 1 Mb region from chromosome 2R pericentric heterochromatin (Panel A) and a 1 Mb region from chromosome 2R euchromatin (Panel B). The location of TE insertions is represented by colored lines (see legends on right side of panel) and piRNA expression for 1 kb bins is shown above and below the chromosome boxes (dark red: high expression, pale yellow: low expression, white: no expression).

