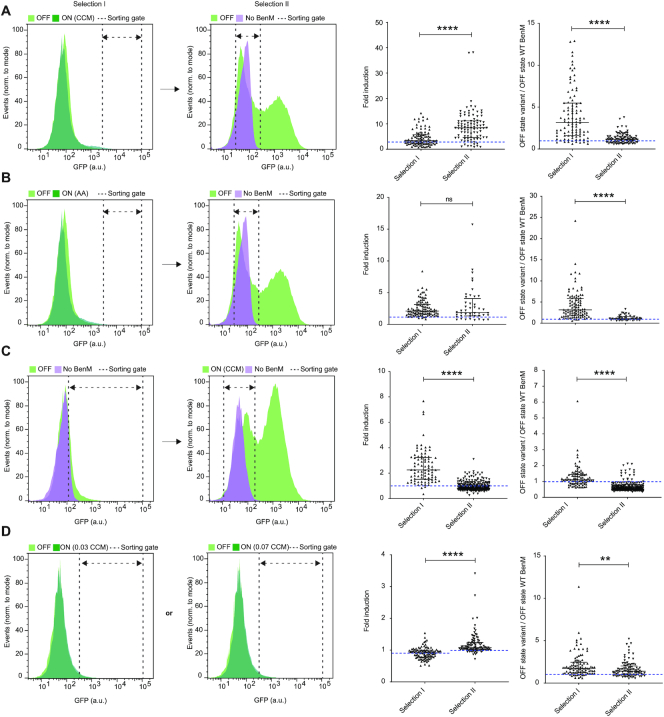
Figure 2.
Directed evolution of biosensor transfer functions and specificities by FACS-based toggled selection. (A) Selection of aTF variants with improved dynamic range. Left and middle-left panels: Representative flow cytometry green fluorescence protein (GFP) intensity distributions showing the aTF library, or a sublibrary thereof, expressing BenM-EBD variants in control medium (OFF – light green), 1.4 mM CCM inducer medium (ON - dark green), and a strain not expressing BenM in control medium (No BenM – light magenta). Middle-right panel: Swarm plot showing fold-changes in GFP intensities of selected evolved variants following one (selection I) or two (selection II) rounds of sorting, compared to WT BenM OFF state (dashed blue line). Right panel: Swarm plots showing OFF states of GFP intensities of evolved variants following selection I or selection II, compared to WT BenM OFF state (dashed blue line). (B) Selection of aTF variants with specificity towards adipic acid. Left and middle-left panels: Same layout as in (A), except for using 14 mM adipic acid, instead of CCM, as inducer medium (ON). Middle-right and right panel: Same lay-out of swarm plots as in (A), yet with BenM WT fold-change towards adipic acid instead of CCM. (C) Selection of aTF variants with inverse transfer functions compared to WT BenM. Left and middle-left panels: Same layout as in (A), except for sorting high-GFP variants in the OFF state in selection I, and variants with GFP intensities similar to yeast without expression of WT BenM (No BenM) in medium containing 5.6 mM CCM (ON) in selection II Middle-right and right panel: Same lay-out of swarm plots as in (A). (D) Selection of aTF variants with changes in operational range towards CCM. Left and middle-left panels: Same layout as in (A), except for using inducer medium with either 0.035 or 0.07 mM CCM as inducer medium (ON). Middle-right and right panel: Same lay-out of swarm plots as in (A). Dashed blue line indicates fold-induction of WT BenM at the two CCM concentrations (0.90 ± 0.05 and 1.02 ± 0.14 for 0.035 mM CCM and 0.070 mM CCM, respectively). (A–D) For all histograms dashed double arrow-headed lines indicate sorting gates. For all swarm plots medians and interquartile ranges are indicated for all middle-right and right panels. Statistical differences between populations (selection I versus selection II) are indicated by asterisks as calculated by the Mann–Whitney test: ns, non-significant; **P ≤ 0.01; ****P ≤ 0.0001. CCM = cis,cis-muconic acid. AA = Adipic acid.

