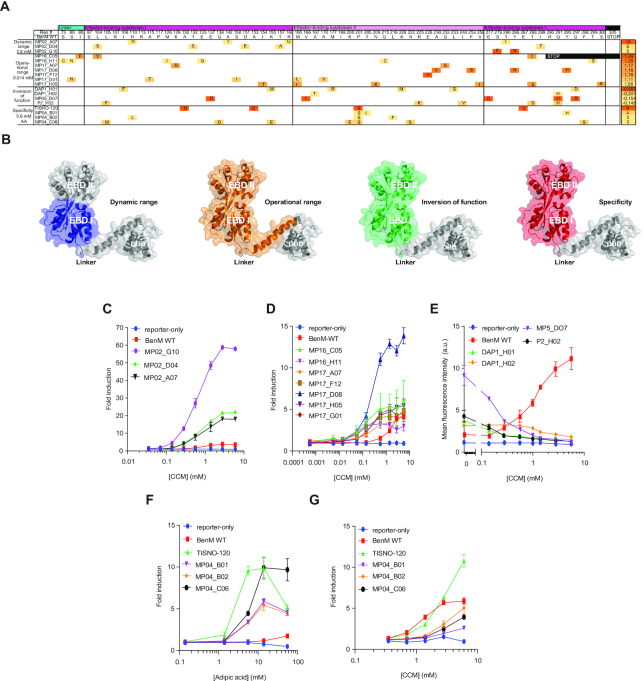
Figure 3.
Sequence-function characterization of WT BenM and evolved archetypical variants. (A) Amino-acid substitution profiles for the four phenotypic categories (left) of evolved BenM variants, with heat-mapping to indicate the BenM variant fold-induction for the lowest inducer concentration with a significant (P < 0.05) response compared to control medium. The displayed score (right) for the archetypical variants of improved dynamic and operational range, as well as for change of specificity, is indicative of fold-change between inducer and control medium for the lowest inducer concentration significantly improving ON state compared to OFF state according to the equation given in Methods. For the inversion-of-function variants, the score represents the correlation coefficient between dose-response curves for WT BenM and evolved variants calculated according to equation given Methods. (B) Depictions of BenM monomeric structures (PDB 3k1n), with domains color-coded for mutational spaces for each of the four phenotypic categories. (C–G) Dose-response curves for BenM variants, WT BenM, and reporter-only control (No BenM). Data represents mean fold-induction for dynamic range (C), operational range (D), and specificity (F–G) variants, whereas for inversion-of-function variants (E), mean fluorescence intensities are displayed. For all plots data represents means ± one standard deviation from three biological replicates. a.u. = arbitrary units.

