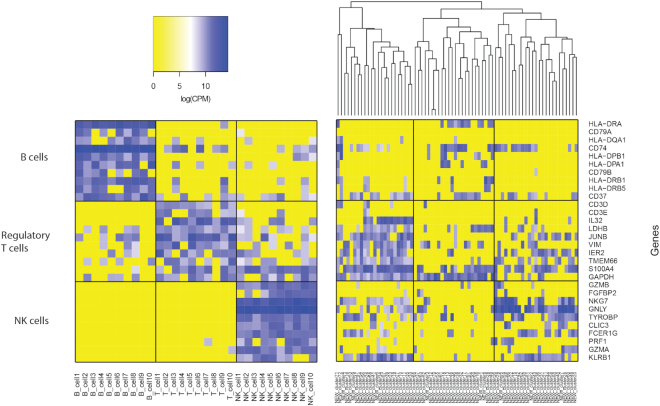
Figure 6.
Marker gene expression for 30 selected single cells with concordant cell labels and 72 single cells in the novel cluster (simple PBMC dataset). Expression of marker genes specific to B, regulatory T, and NK cells. Left: expression heatmap of 30 single cells for which SAME cluster labeling agrees with gold-standard annotations. Right: heatmap of 72 single cells belonging to the new cluster identified by SAME.

