
Figure 4.
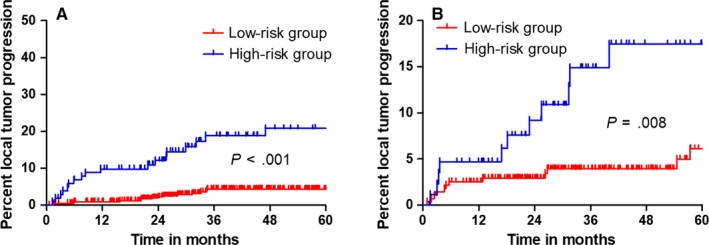
Graphs show results of Kaplan‐Meier local tumor progression (LTP) analyses according to the nomogram in the training dataset (A) and those in the validation dataset (B). A significant association of the nomogram with the LTP was shown in the training dataset, which was then confirmed in the validation dataset