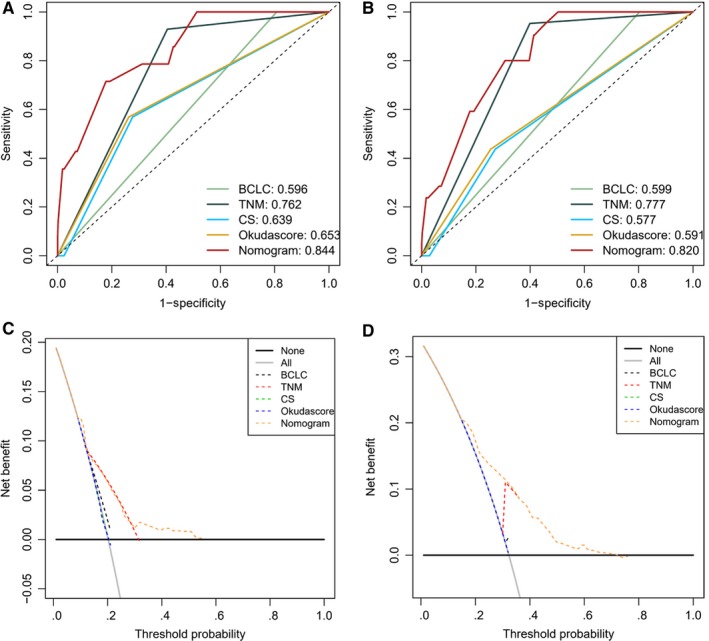
Figure 6.

Comparison of predictive accuracy for local tumor progression after MWA between the nomogram and the conventional system. (A) AUC analyzed in training dataset; (B) AUC analyzed in validation dataset. Decision curve analysis (DCA) for each model. The y‐axis measures the net benefit. The net benefit was calculated by summing the benefits (true‐positive results) and subtracting the harms (false‐positive results). (A) DCA analyzed in training dataset; (B) DCA analyzed in validation dataset
