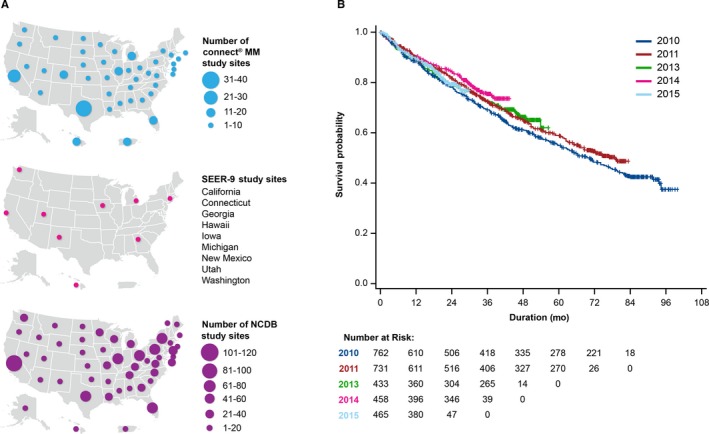
Figure 1.

A, Connect MM, SEER‐9, and NCDB sites. B, Connect MM OS by year of enrollment. 2009 and 2010 data were combined. OS was adjusted for the following covariates: age group, sex, and race. MM indicates multiple myeloma; NCDB, National Cancer Database; OS, overall survival; SEER, Surveillance, Epidemiology, and End Results; US, United States.
