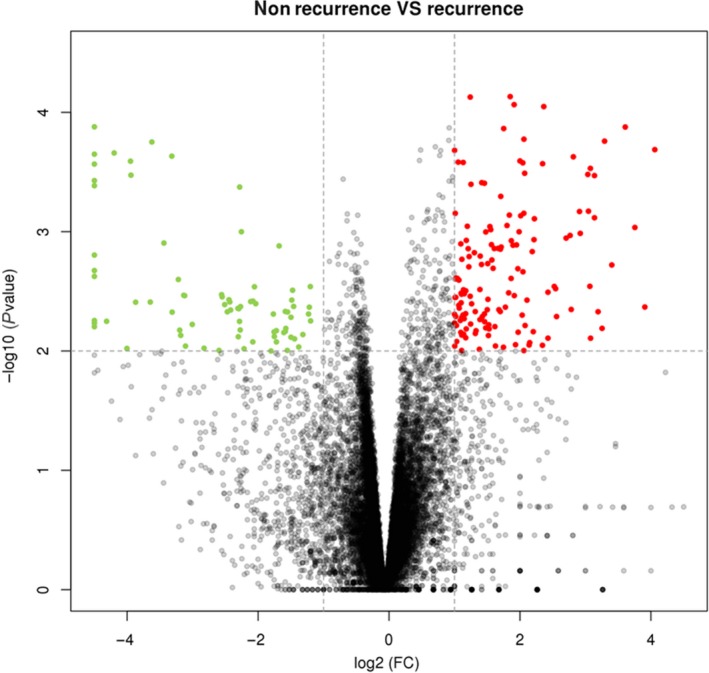
Figure 1.

Volcano plot of the DEGs between recurrence and nonrecurrence groups of stage II CRC. The x‐axis indicates the log2 fold change in gene expression, which was defined as the ratio of normalized value of gene expression detected in stage II CRC between recurrence and nonrecurrence groups. The y‐axis indicates the adjusted P values plotted in −log10. Red dots highlight genes upregulated in recurrence group (fold change >2, P value <.01). Green dots highlight genes downregulated in nonrecurrence group (fold change >2, P value <.01). CRC, colorectal cancer; DEGs, differentially expressed genes
