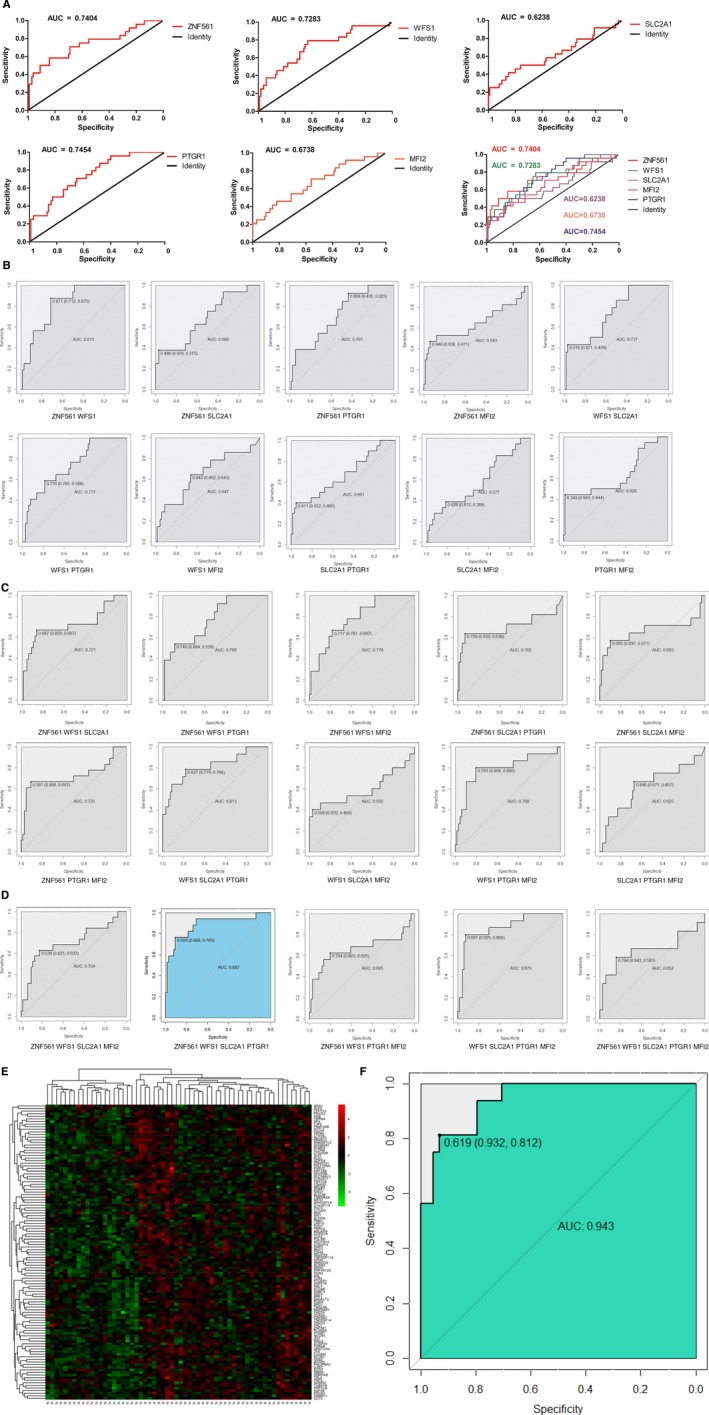
Figure 2.

ROC curves of the top 5 DEGs sorted by AUC. Red line represents the sensitive curve, while black represents the identify line. The x‐axis indicates false positive rate, which is presented as “Specificity (1 − Sensitivity)”. The y‐axis indicates true positive rate, which is presented as “Sensitivity”. A, The individual diagnostic efficiency of ZNF561, WFS1, SLC2A1, MFI2, and PTGR1. B, The joint diagnostic efficiency of the combinations of the two DEGs in the top 5. C, The joint diagnostic efficiency of the combinations of the three DEGs in the top 5. D, The joint diagnostic efficiency of the combinations of the four or five DEGs in the top 5. E, Heatmap of the DEGs between recurrence and nonrecurrence groups of stage II CRC. Each column showed patient samples. N represented nonrecurrence. R represented recurrence. A hierarchical clustering analysis was performed, and patient information based on the expression of DEGs was mapped. Red represented upregulated genes. Green represented downregulated genes. F, The diagnostic efficiency of GRM in GEO date. AUC, area under the curve; CRC, colorectal cancer; DEGs, differentially expressed genes; GRM, gene recurrent model; ROC, receiver operating characteristic
