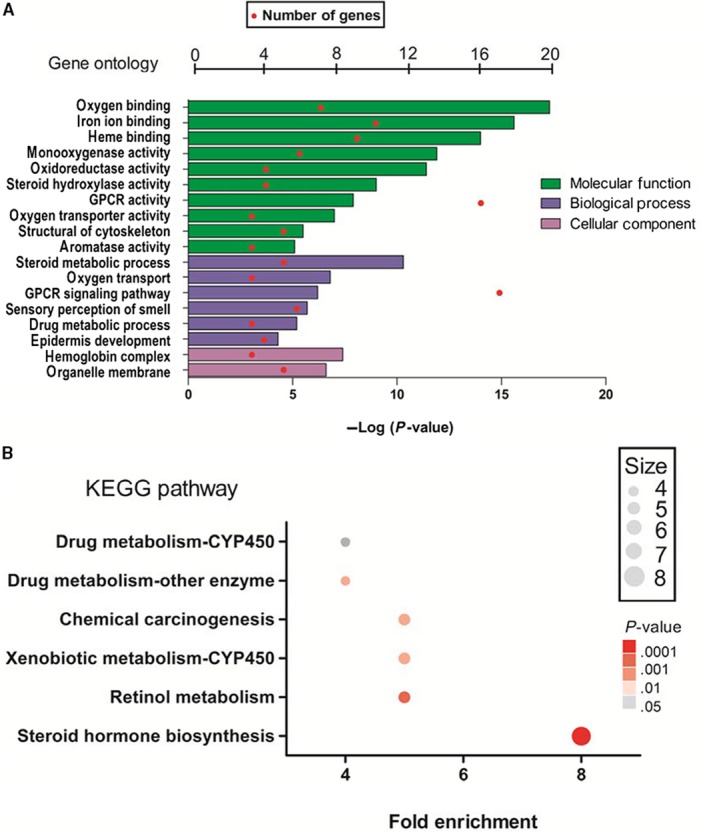
Figure 4.

DAVID analysis of DEGs: A, GO functional annotation of top 18 enrichment terms. B, KEGG pathway enrichment analysis of top 6 enrichment terms. The count of genes enriched in terms is indicated by the node size; the P value is shown by the color, the redder the color, the more significant it is. DAVID, Database for Annotation, Visualization, and Integrated Discovery; DEGs, differentially expressed genes; GO, gene ontology; KEGG, Kyoto Encyclopedia of Genes and Genomes
