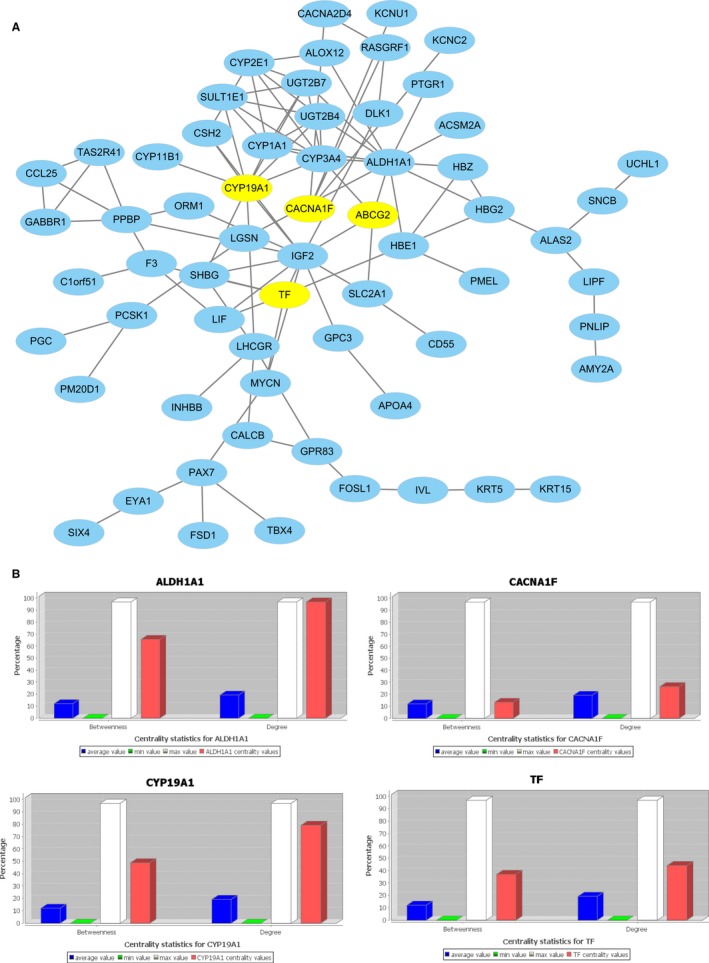
Figure 5.

PPI Network of DEGs in recurrence compared nonrecurrence. The nodes indicate the DEGs and the edges indicate the interactions between two genes. The yellow nodes indicating important were selected as hub genes. A, The hub genes identified and visualized by degree and betweenness. B, Centrality statistics for hub genes: ABCG2, CACNA1F, CYP19A1, TF. DEGs, differentially expressed genes; PPI, protein‐protein interaction
