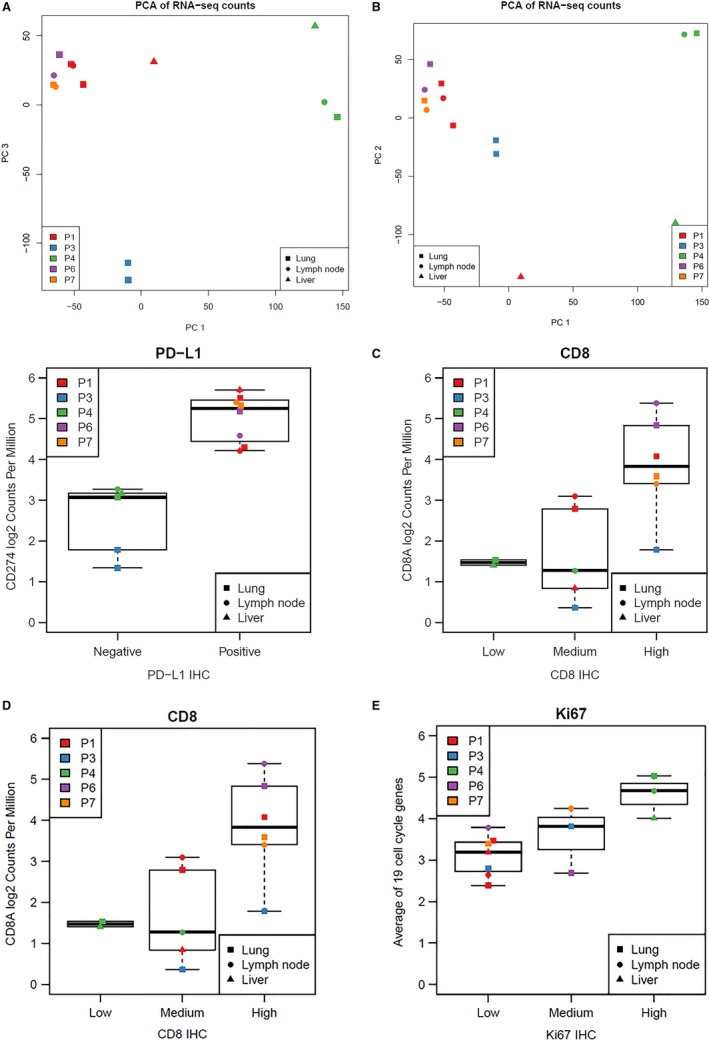
Figure 4.

Compilation of RNA Results. A, Global similarity of RNA profiles among multiple tumor sites. The first and third principal components are shown for the normalized log2 RNA‐seq counts per million for all genes. A, The third principal component is shown instead of the second as this corrects for elevated levels of liver‐specific transcripts. B, The second principal component is shown instead of the third to show results without correction for elevated levels of liver‐specific transcripts. C‐E, Concordance between RNA‐seq and IHC for PD‐L1, CD8, and Ki‐67. The vertical axis denotes the normalized log2 RNA‐seq counts per million for the indicated genes. The horizontal axis denotes the final categorical result for PD‐L1, CD8, and Ki‐67 expression by immunohistochemistry analyses as outlined in Table S1. PD‐L1 immunochemistry data was generated using the PD‐L1 antibody clone 28‐8 with ≥1% tumor proportion score considered as “Positive”
