Figure 3.

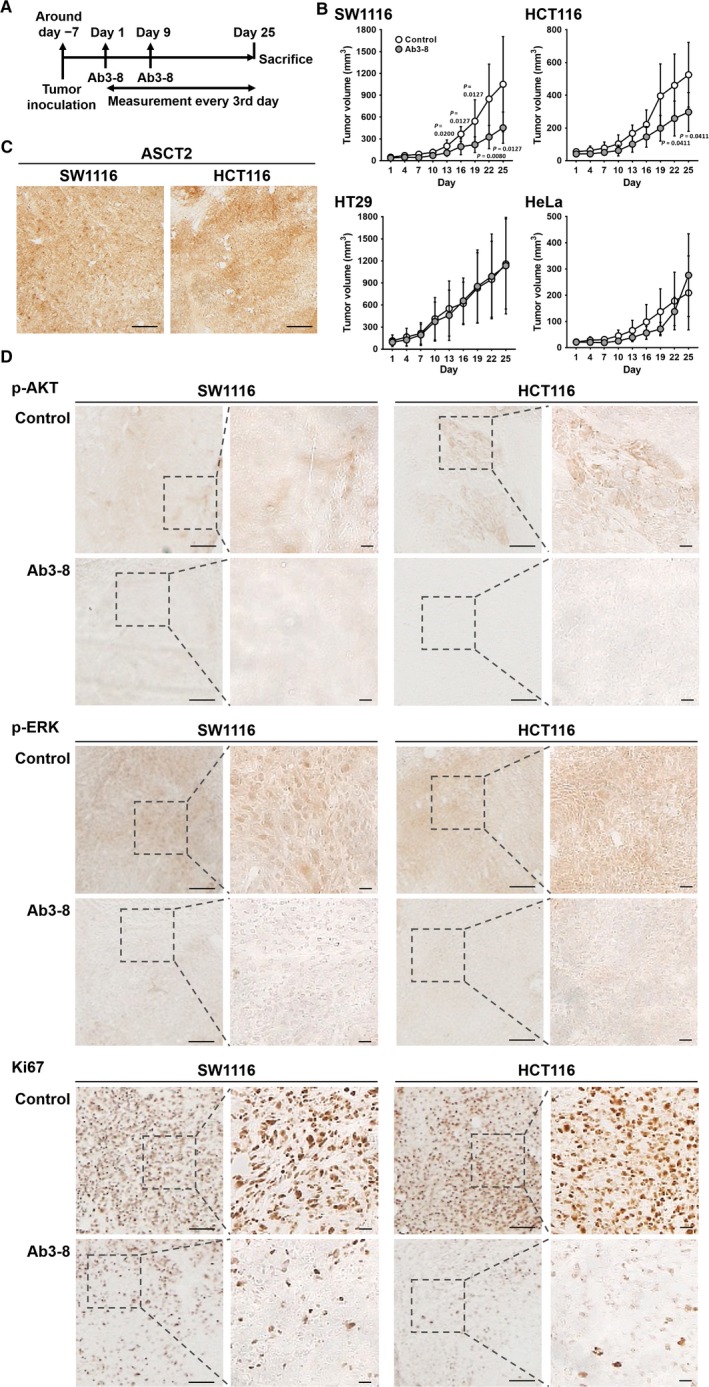
Anti‐tumor effects of Ab3‐8. Cells were injected subcutaneously into the left/right flanks of male nude mice. A, Time course of the in vivo anti‐tumor study. B, Tumor volumes of CRC and HeLa cells were measured every 3 d using digital calipers, and were quantified using the formula: volume [mm3] = (length [mm]) × (width [mm])2 × 0.5. Ab3‐8 (100 μg/mouse) was intraperitoneally administered on days 1 and 9. Each dot represents the mean of 4‐9 mice. Data are expressed as the mean ± SD. Tumor volume of individual mice shows in Figure S3. C,Tumor sections from control mice were subjected to immunoperoxidase staining using Ab3‐8. Scale bar, 20 μm. D, Tumor sections were subjected to immunoperoxidase staining using the indicated antibodies. Representative images of the SW1116‐ and HCT116‐derived tumor sections, which immune labeled with p‐AKT, p‐ERK and Ki67. Images were obtained at 4 × magnification. Scale bar, 20 μm. Insets, higher magnification of the boxes. Images were obtained at 20 × magnification. Scale bar, 20 μm
