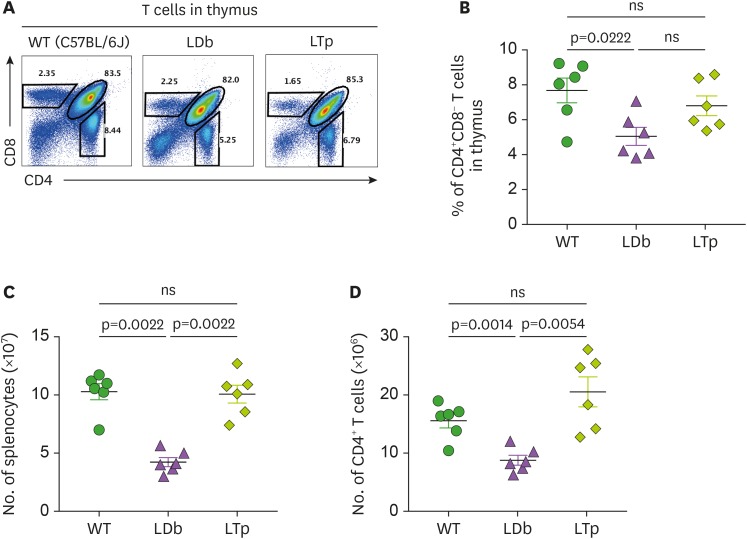
Figure 2. Analysis of T cell in the thymus and the spleen of C57BL/6J, LDb and LTp mice.
(A) A representative result of flow cytometry analysis showing the frequencies of T cell populations in the thymus of WT (C57BL/6J), LDb and LTp mice is shown. (B) The frequencies of CD4+CD8− T cells from the thymus of WT (C57BL/6J), LDb and LTp mice (male mice at 5-months of age, n=6 for each strain) were analyzed by flow cytometry. The results of the analyses and mean±SD are shown. (C) The total number of splenocytes in the spleen of WT (C57BL/6J), LDb and LTp mice (male mice at 5-months of age, n=6 for each strain) were analyzed by flow cytometry. The results of the analyses and mean±SD are shown. (D) The total number of CD4+ T cells in the spleen of WT (C57BL/6J), LDb and LTp mice (male mice at 5-months of age, n=6 for each strain) were analyzed by flow cytometry. The results of the analyses and mean±SD are shown. Statistical analysis of results was performed using 2-tailed unpaired t-tests with Welch's correction. The p values are listed. The p<0.05 is considered significantly.
ns, not significant.

