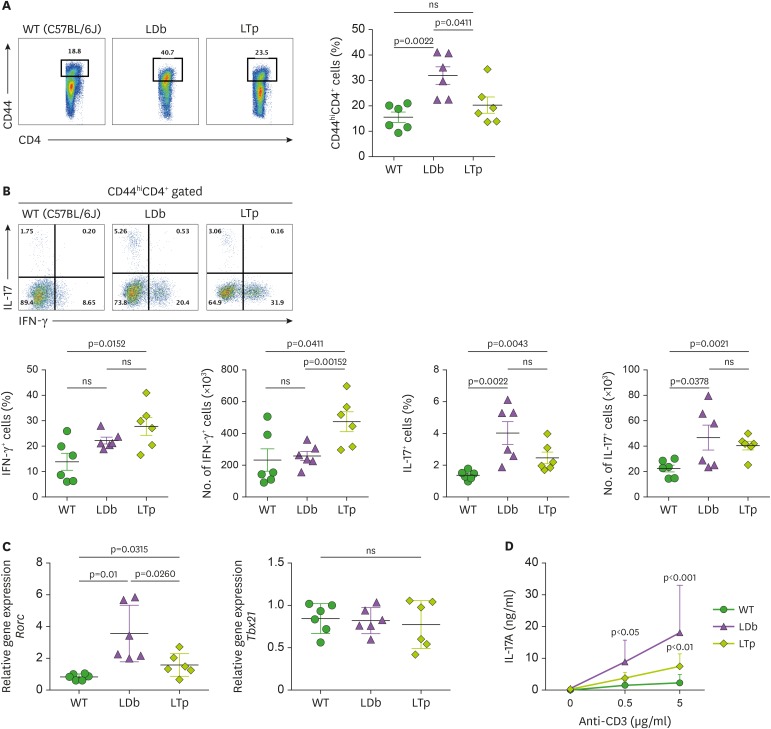
Figure 4. Deficiency of PCSK9 reduces the expression and secretion of IL-17 from Th subset cells (CD44hiCD4+) obtained from the spleens of C57BL/6J (WT), LDb, and LTp mice.
(A) The frequencies of CD44hiCD4+ T cells from the spleen of WT (C57BL/6J), LDb, and LTp mice were analyzed using flow cytometry. The results of the frequencies of CD44hiCD4+ T cells and mean±SD are shown on the right. (B) The frequencies of IFN-γ and IL-17 expressing cells from CD44hiCD4+ T cells in the spleen of WT (C57BL/6J, n=6), LDb (n=6), and LTp (n=6) mice are analyzed by flow cytometry. The frequencies and total number of IFN-γ and IL-17 expressing cells from CD44hiCD4+ T cells are presented and mean±SD are also shown. (C) The relative expression levels of mRNA transcripts of Rorc and Tbx21 genes from the flow cytometry sorted CD44hiCD4+T cells of the spleen of WT (C57BL/6J), LDb, and LTp mice (n=6 from each strain) were determined using real-time qPCR. The sorted CD44hiCD4+T cells were stimulated with anti-CD3 (1 μg/ml) for 4 h, followed by RNA extraction and qPCR determination. The RNA levels from each animal and the mean±SD are shown. Statistical analyses of results in figures A to C was performed using 2-tailed unpaired t-tests with Welch's correction. The p values are listed. The p<0.05 is considered significantly. ns, not significant. (D) Re-stimulated CD44hiCD4+ T cells from LDb mice secret more IL-17. The flow cytometry sorted CD44hiCD4+ T cells (2×10⁵ cells) from the spleen of WT (C57BL/6J), LDb, and LTp mice were re-stimulated with different concentrations of anti-CD3 (0, 0.5, and 5 µg/ml) for 3 days. The IL-17 (ng/ml) secreted to the media was measured using ELISA. The results are presented as mean±SD at each concentration. Data represents 3 independent experiments. Statistical analysis was performed using 2-way ANOVA. The p values are listed.
ns, not significant.

