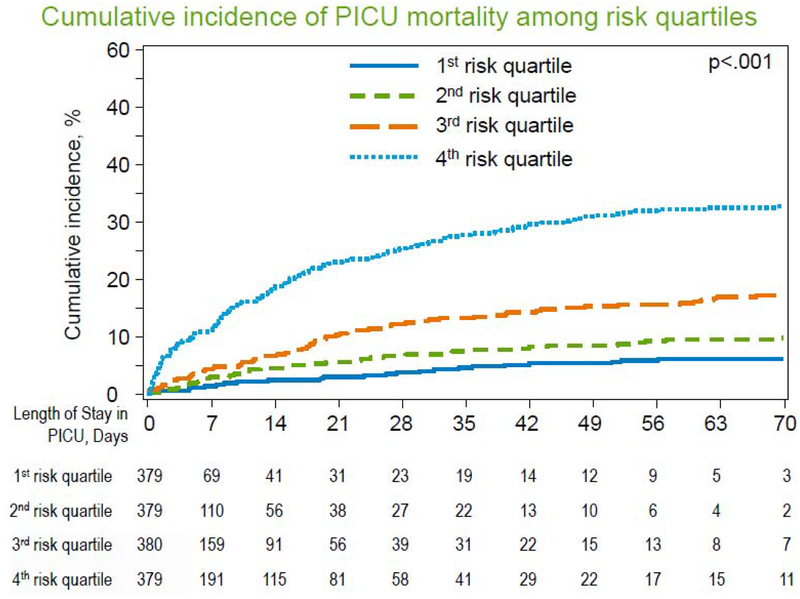
Figure 3. PICU Mortality Stratified by Multivariate Risk Group.
A multivariable model using 5 clinical variables accurately cumulative incidence of PICU mortality over time. Cumulative incidence of mortality for patients in the 1st, 2nd, 3rd, and 4th quartiles of risk according to the multivariable model are plotted across PICU length of stay. Patients who were discharged alive are censored at the time of PICU discharge. Comparison of cumulative incidence curves using Gray’s test demonstrated significant differences in curves (p<0.001).

