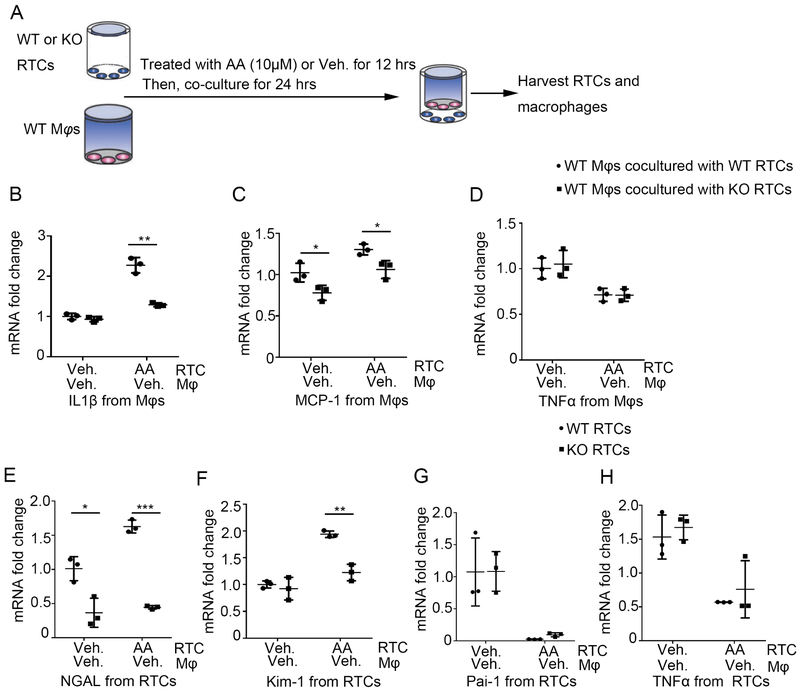
Figure 8. Twist1 in kidney epithelial cells enhances IL-1β and MCP-1 expression in macrophages.
(A) Schematic diagram showing the experimental setup of testing gene levels from macrophages and epithelial cells. (B-D) mRNA expression of IL1β (B), MCP-1(C) and TNFα (D) from co-cultured macrophages among group as indicated (n=3). (E-H) mRNA expression of NGAL (E), Kim-1 (F), Pai-1 (G) and TNFα (H) from co-cultured epithelial cells among groups as indicated (n=3). Data represent the mean± SD (*p<0.05, **p<0.01, ***p<0.01).

